
The Daily Shot: 07-Dec-21
• The United States
• Canada
• The United Kingdom
• The Eurozone
• Japan
• Asia – Pacific
• China
• Emerging Markets
• Cryptocurrency
• Commodities
• Energy
• Equities
• Rates
• Food for Thought
The United States
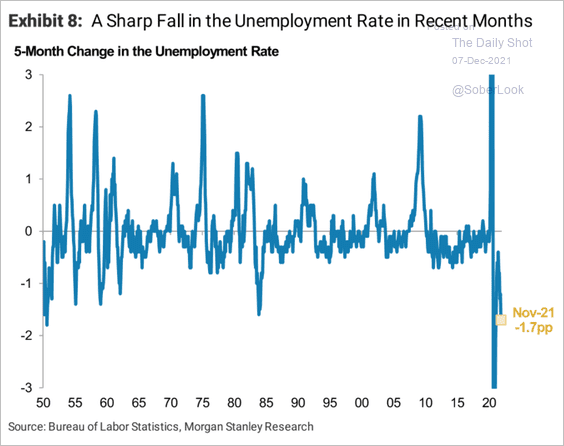
1. Let’s begin with some additional updates on the US labor market.
• The decline in unemployment was unusually sharp over the past five months.
 Source: Morgan Stanley Research
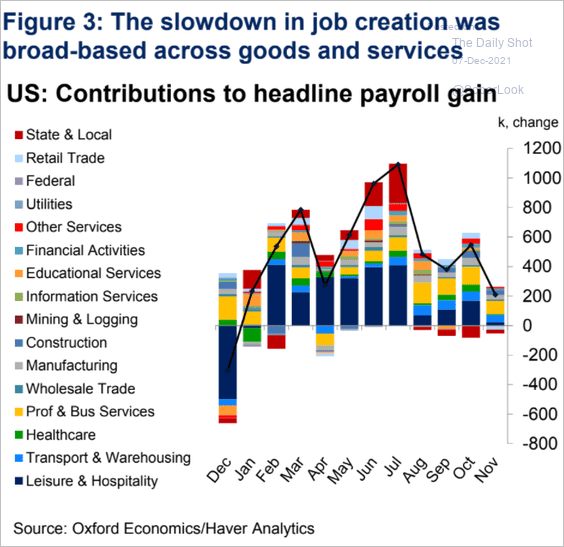
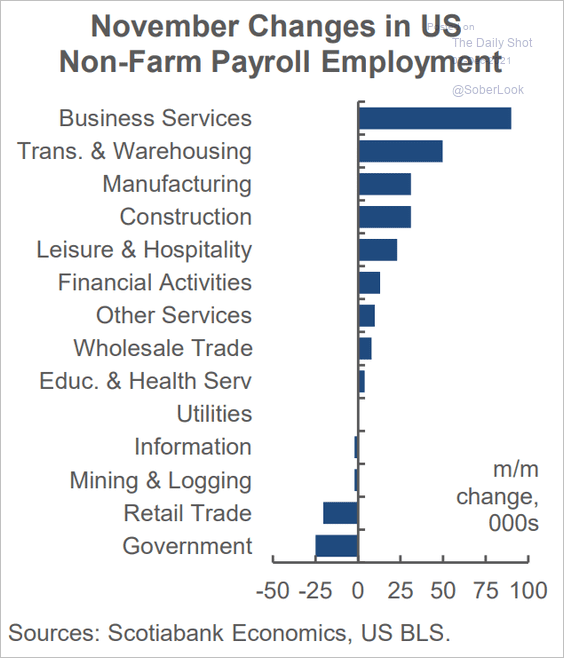
• Here are the contributions to payroll gains by sector (2 charts).
 Source: Oxford Economics
 Source: Scotiabank Economics
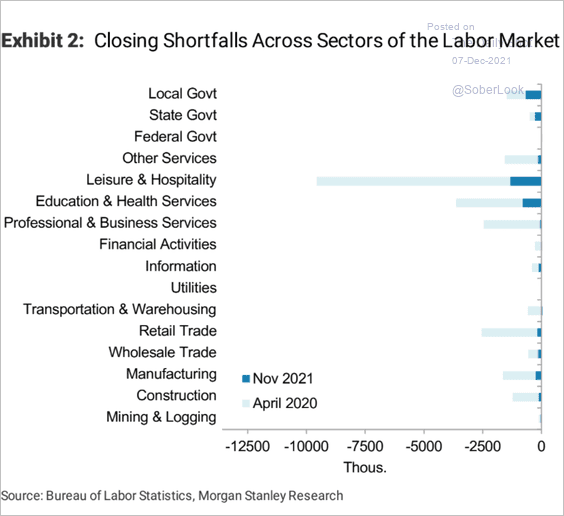
• Employment shortfalls by sector vs. pre-pandemic levels (2 charts):
 Source: Morgan Stanley Research
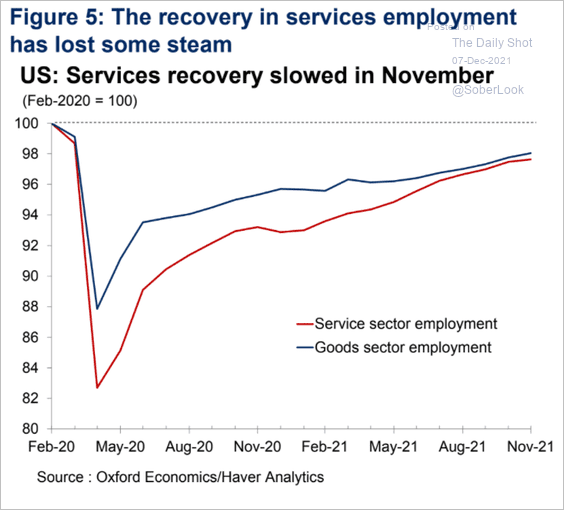 Source: Oxford Economics
• The quits rate rises as switching jobs becomes more lucrative.
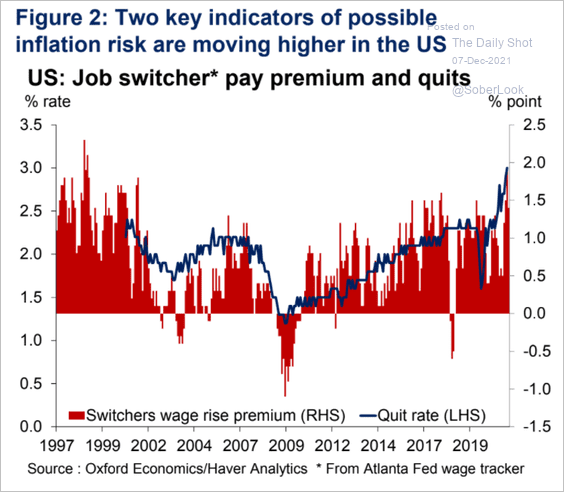 Source: Oxford Economics
• Payrolls are not a good measure of labor market tightness. The quits rate is a better indicator and it suggests that the US is near “full employment.”
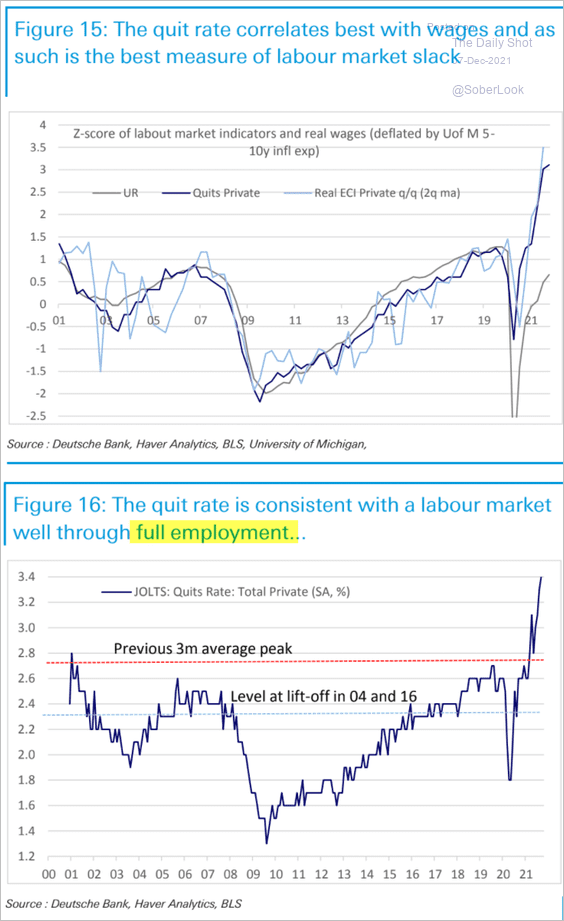 Source: Deutsche Bank Research
• Production employee wages have been outpacing the overall workforce (2 charts).
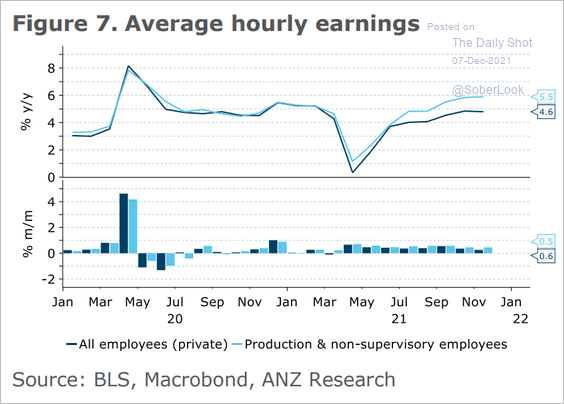 Source: ANZ Research
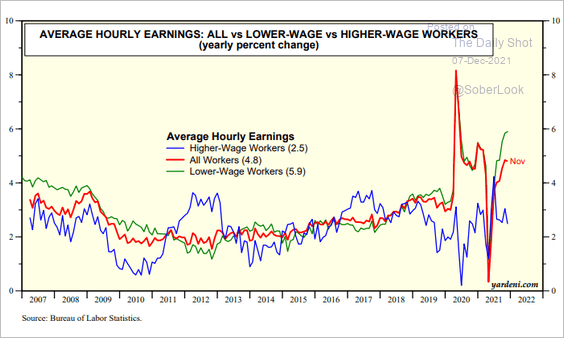 Source: Yardeni Research
• Which industries are most concerned about labor shortages and labor costs?
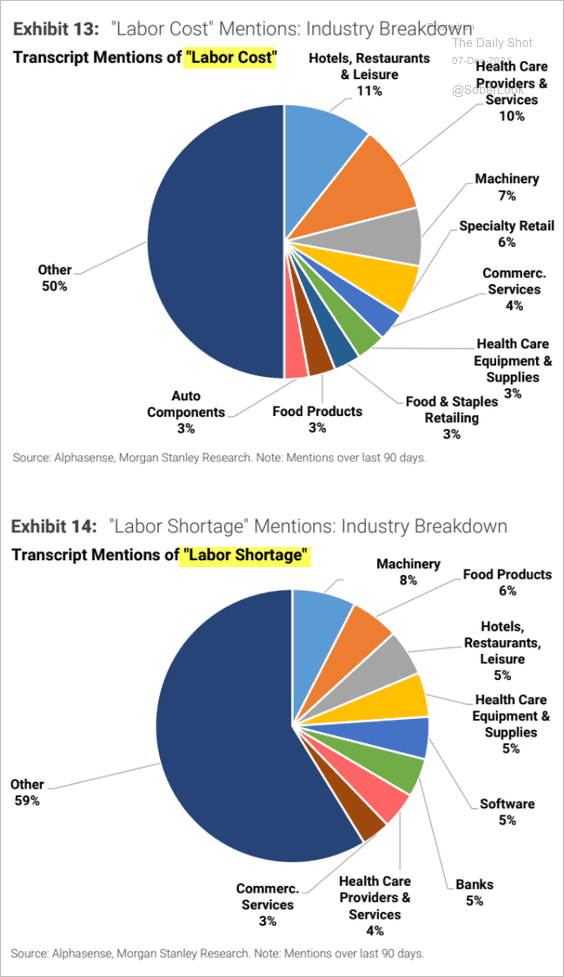 Source: Morgan Stanley Research
• Real wages are starting to catch up with productivity growth, potentially pressuring corporate margins.
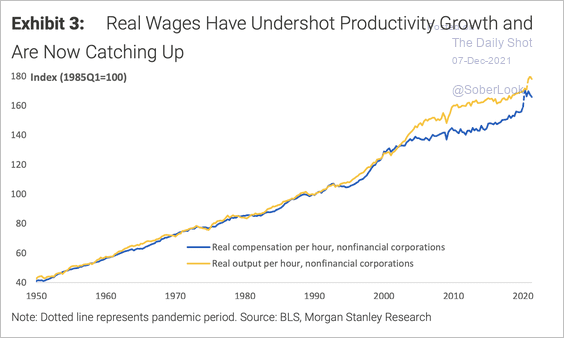 Source: Morgan Stanley Research
The rise of tech has meant that a bigger portion of compensation is in the form of stock. This is not captured in the employment cost index and explains in part the divergence between wages and productivity.
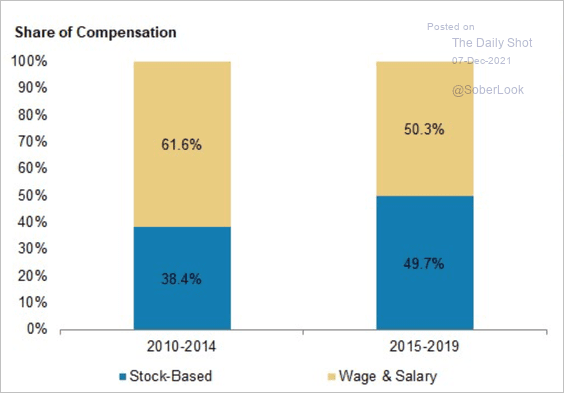 Source: Morgan Stanley Research
——————–
2. The real fed funds rate is at extremes no matter which index is used to measure inflation. It points to extraordinary levels of monetary accommodation.
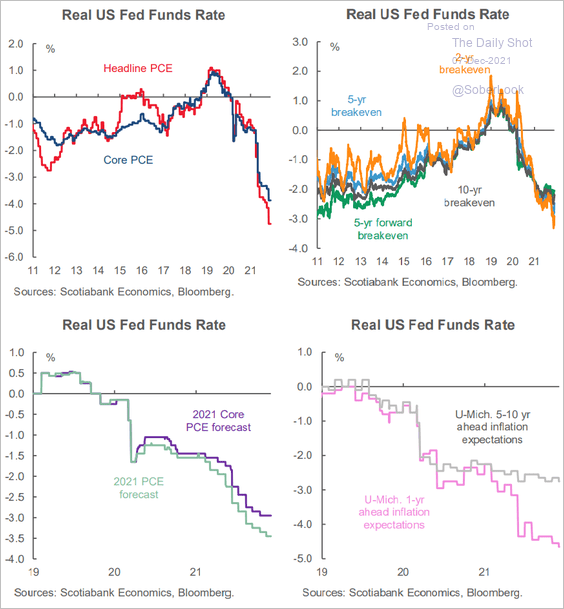 Source: Scotiabank Economics
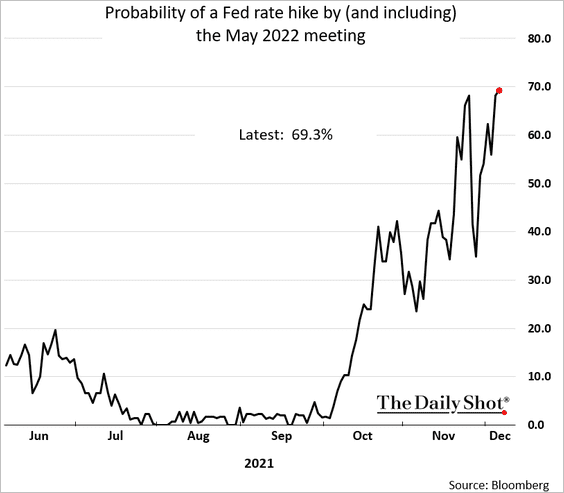
The market is now assigning a decent probability that the Fed will hike rates by May.
——————–
3. Consumer credit card spending continues to rise.
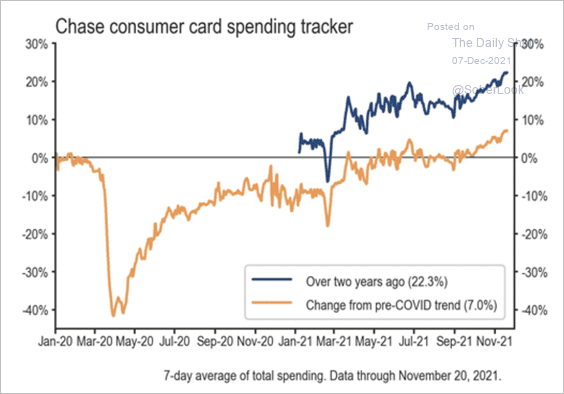 Source: JP Morgan Research
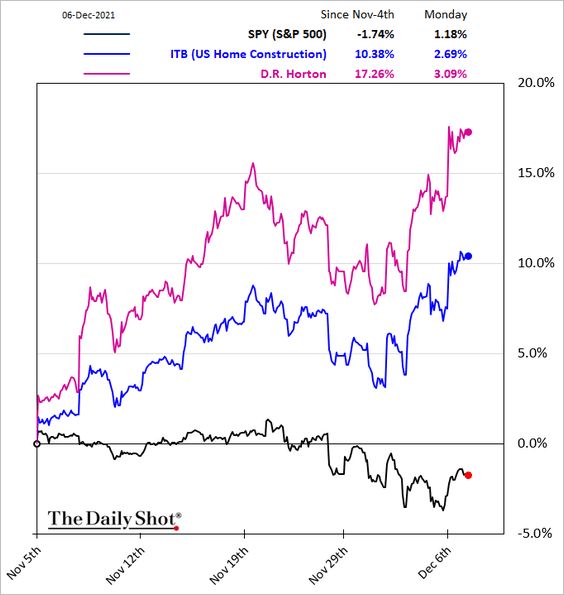
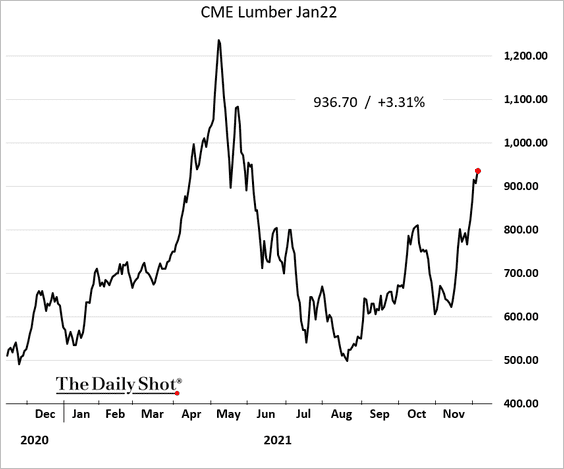
4. High-frequency indicators point to an acceleration in residential construction activity.
• Homebuilder shares:
• Lumber futures:
Home improvement stocks have been outperforming sharply as well.
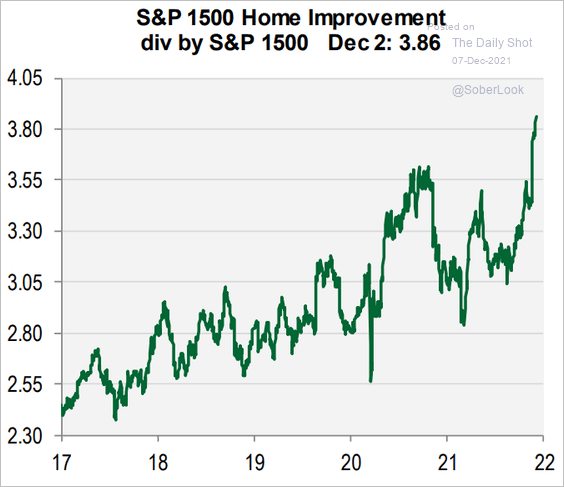 Source: Cornerstone Macro
Separately, Fannie Mae and Freddie Mac increasingly waive home appraisals in mortgage financing transactions.
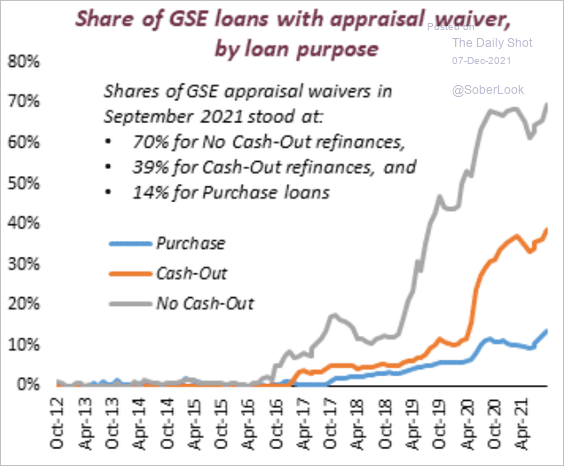 Source: AEI Center on Housing Markets and Finance
——————–
5. Goldman downgraded its US GDP growth estimates due to omicron.
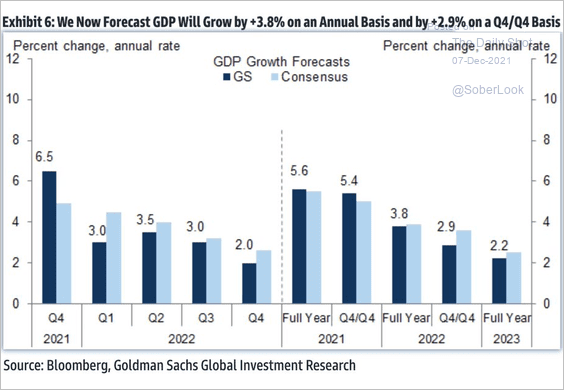 Source: Goldman Sachs; @GunjanJS
Back to Index
Canada
1. COVID restrictions remain elevated relative to the US.
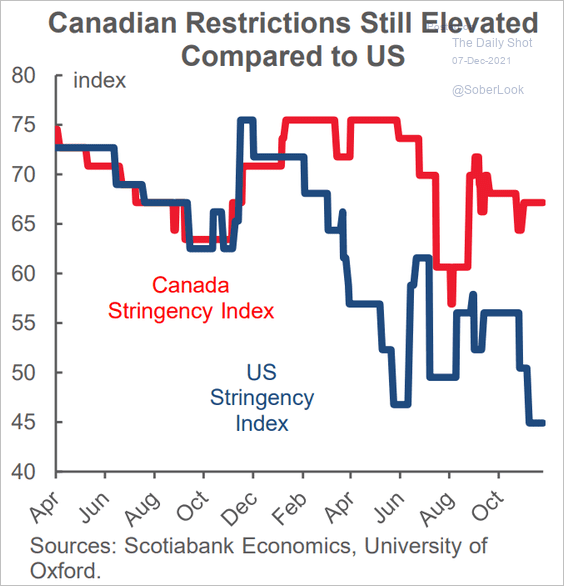 Source: Scotiabank Economics
2. Manufacturing employment surged in November.
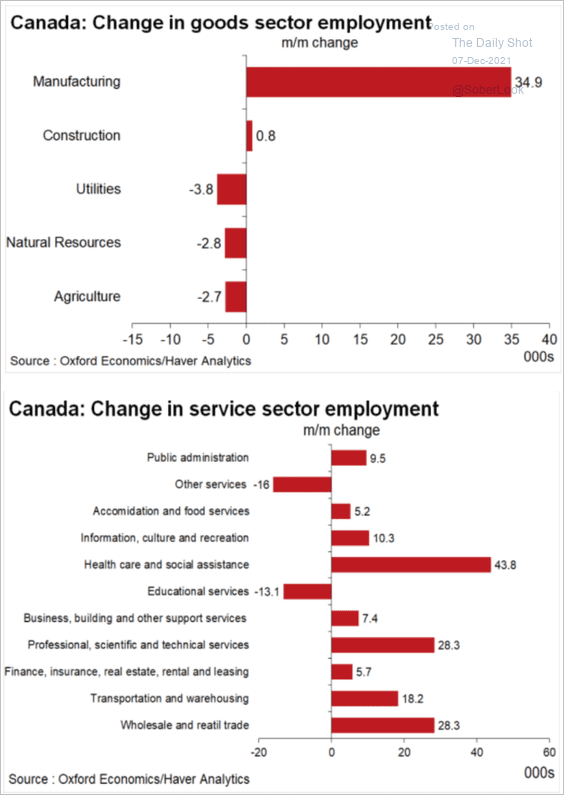 Source: Oxford Economics
Here are the changes in employment vs. pre-pandemic levels.
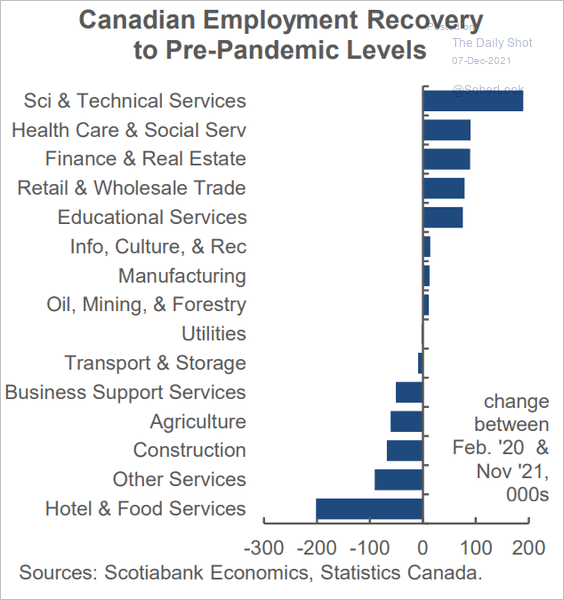 Source: Scotiabank Economics
——————–
3. Canada is well into full employment.
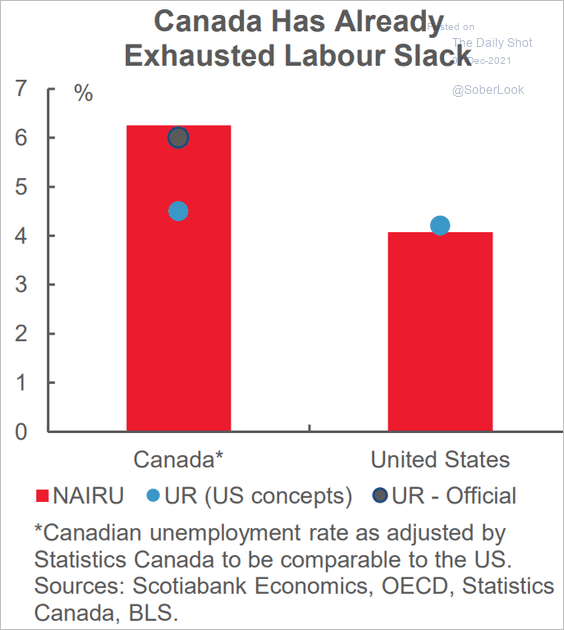 Source: Scotiabank Economics
4. The BoC policy is extraordinarily accommodative.
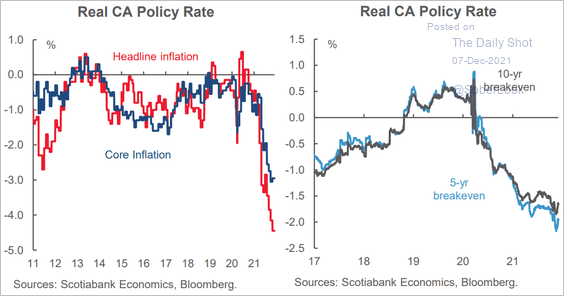 Source: Scotiabank Economics
Back to Index
The United Kingdom
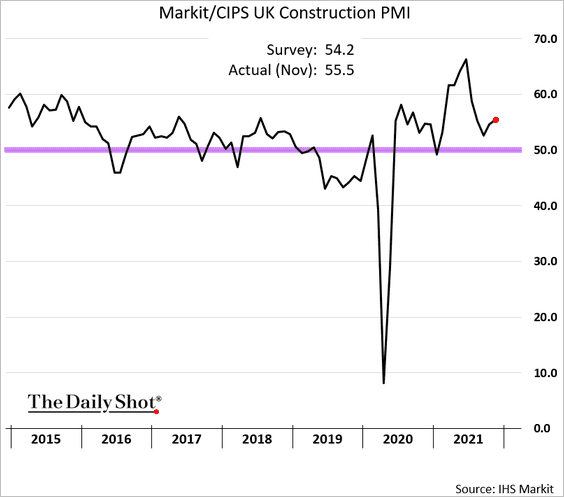
1. Construction activity firmed in November.
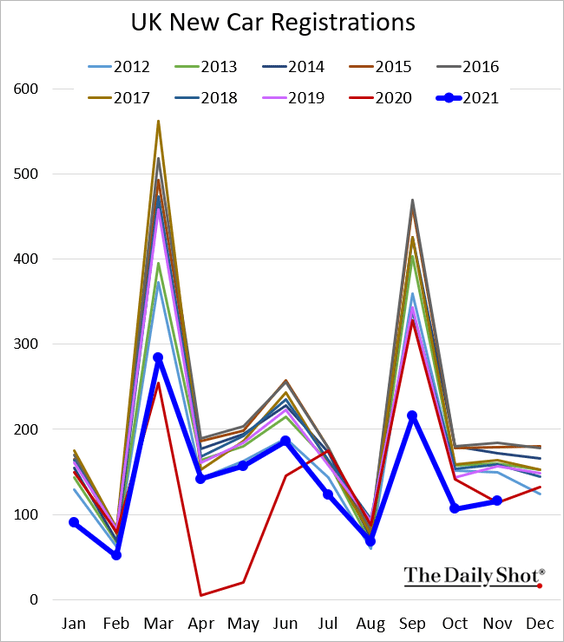
2. New car registrations remain soft (units = ‘000).
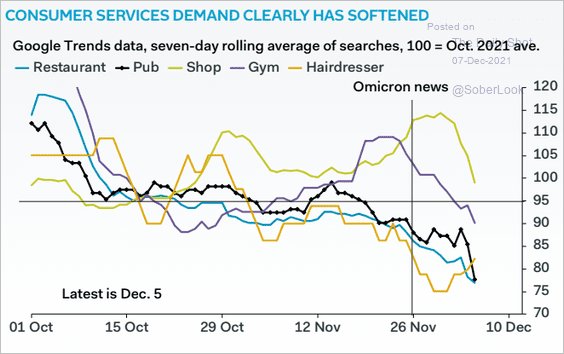
3. Google search trends point to weakening consumer services demand.
 Source: Pantheon Macroeconomics
4. Households are drawing on their home equity again.
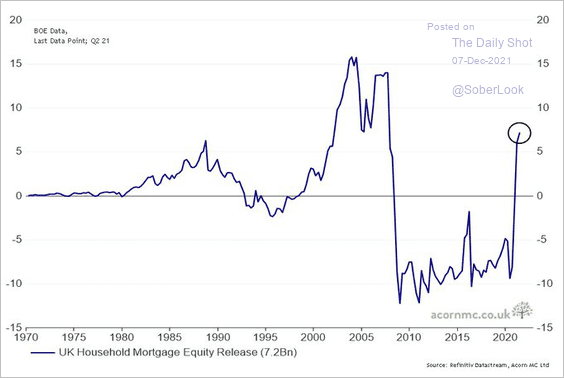 Source: @RichardDias_CFA
Back to Index
The Eurozone
1. Let’s begin with Germany.
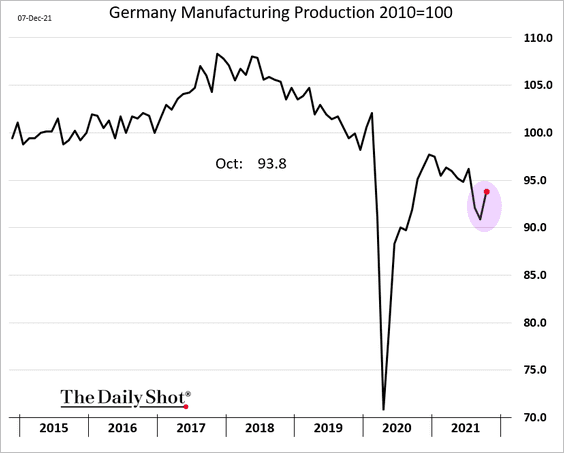
• Industrial production rebounded in October. This chart shows just the manufacturing component.
• Truck movements show further gains for industrial activity.
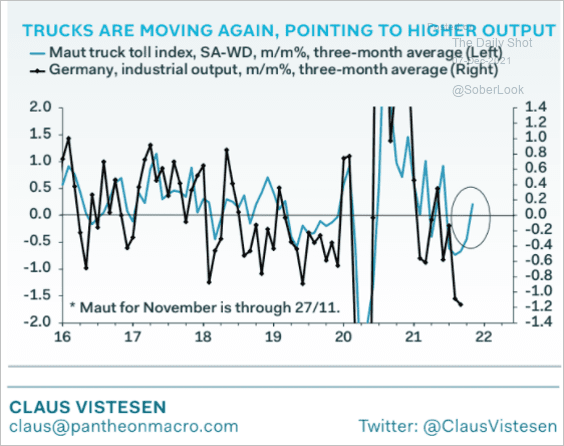 Source: Pantheon Macroeconomics
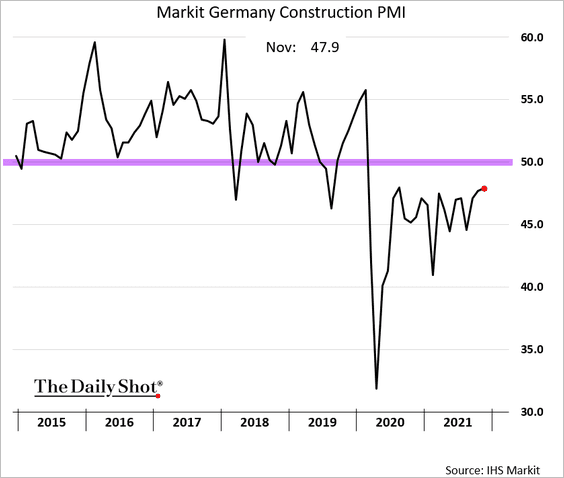
• Construction activity remains soft.
• This scatterplot shows vaccination rates vs. COVID cases.
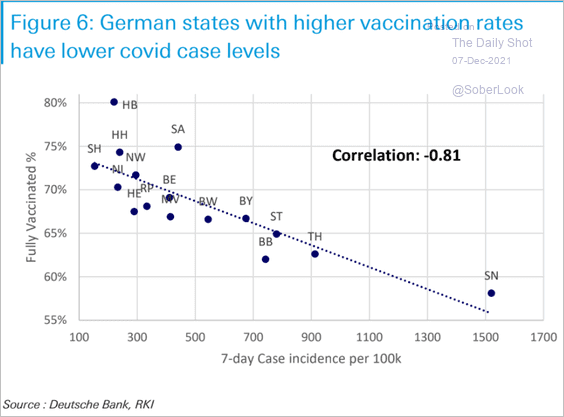 Source: Deutsche Bank Research
——————–
2. Eurozone sovereign spreads have been widening over the past month (relative to Germany).
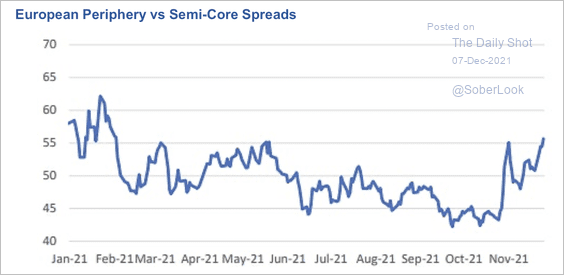 Source: Deutsche Bank Research
3. Here are the latest French presidential election polls.
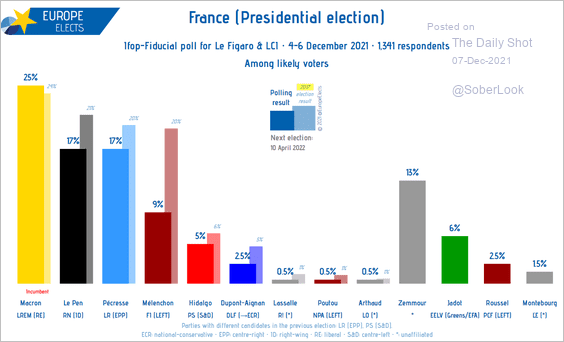 Source: @EuropeElects Read full article
4. The economies of Italy and France are expected to outperform this year.
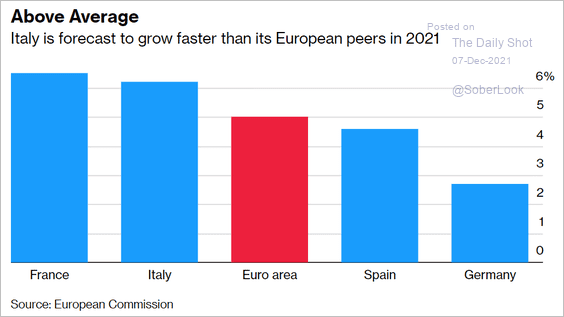 Source: Bloomberg Read full article
5. Finally, we have the GDP deviations vs. pre-COVID levels.
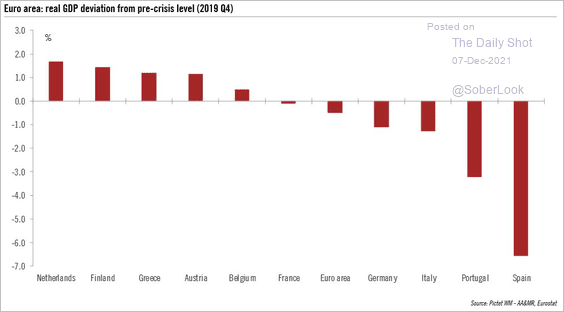 Source: @nghrbi
Back to Index
Japan
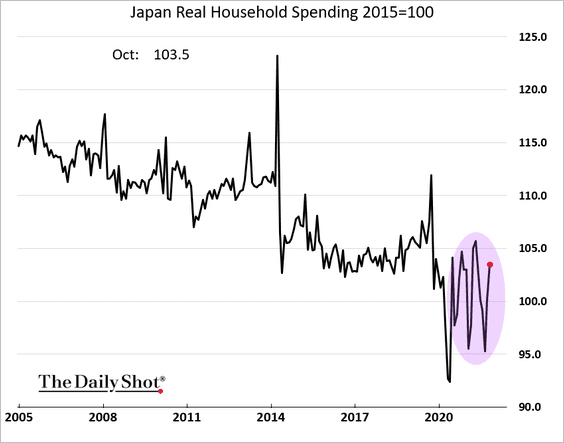
1. Household spending rebounded in October, but the index has been volatile.
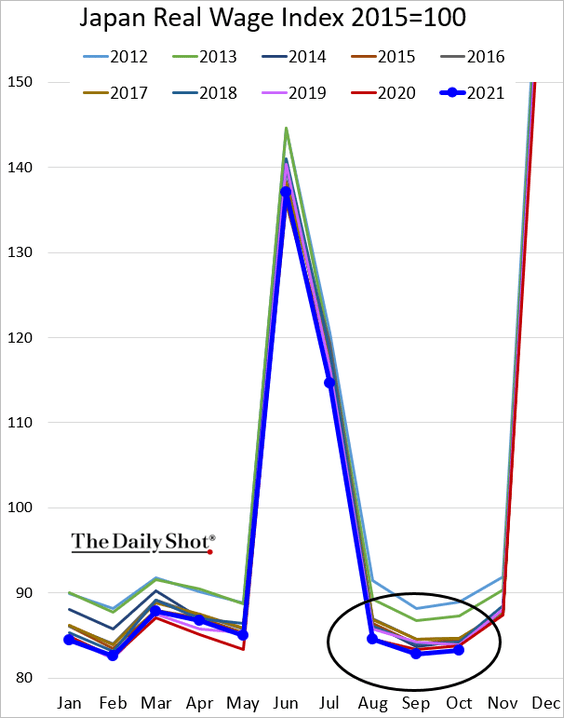
2. Real wages remain depressed.
3. Japan’s tech shares have been outperforming.
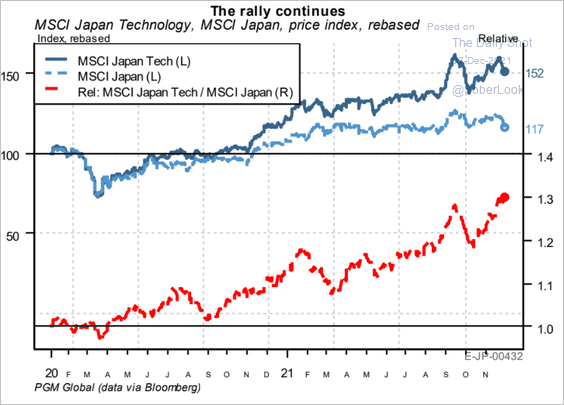 Source: PGM Global
4. Defense spending is surging.
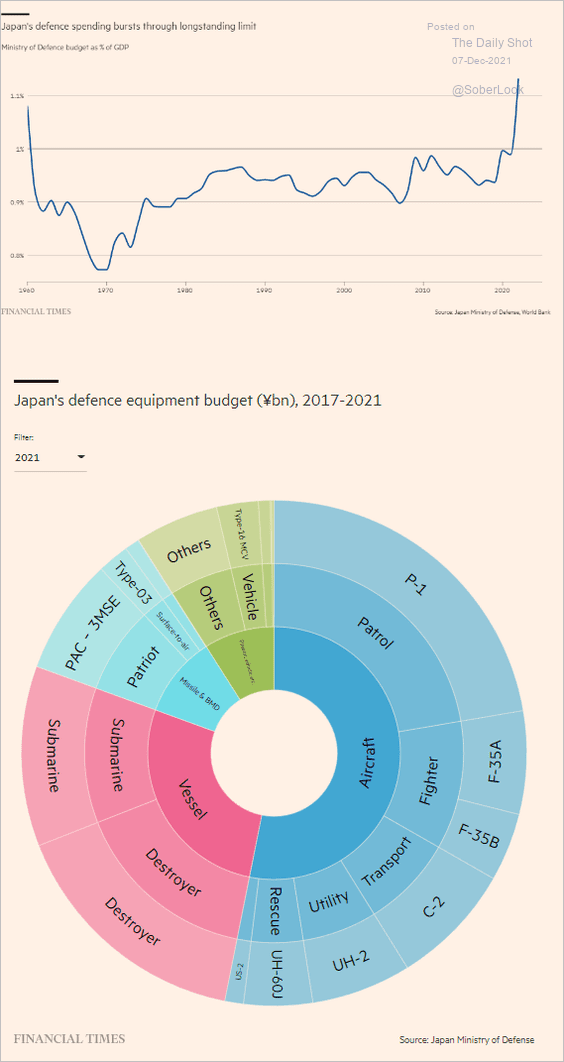 Source: @financialtimes Read full article
Back to Index
Asia – Pacific
1. US trade with Taiwan has accelerated.
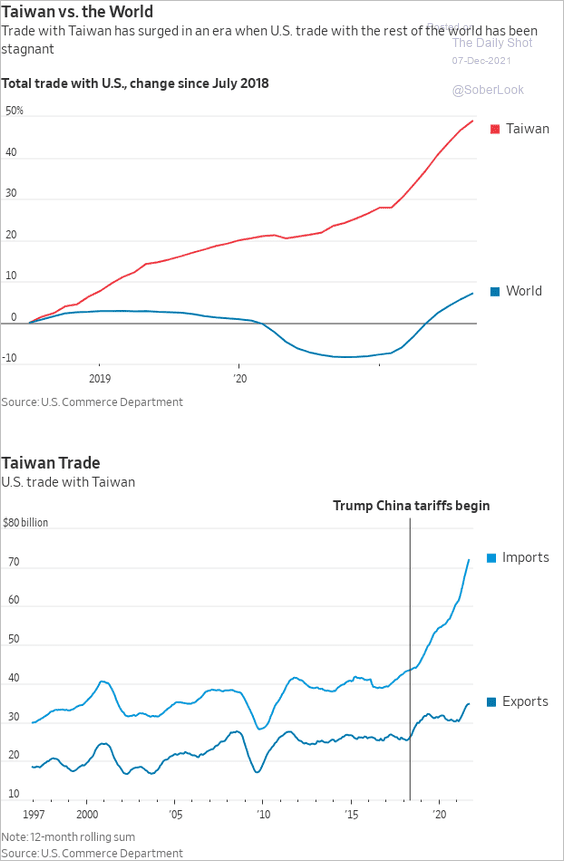 Source: @WSJ Read full article
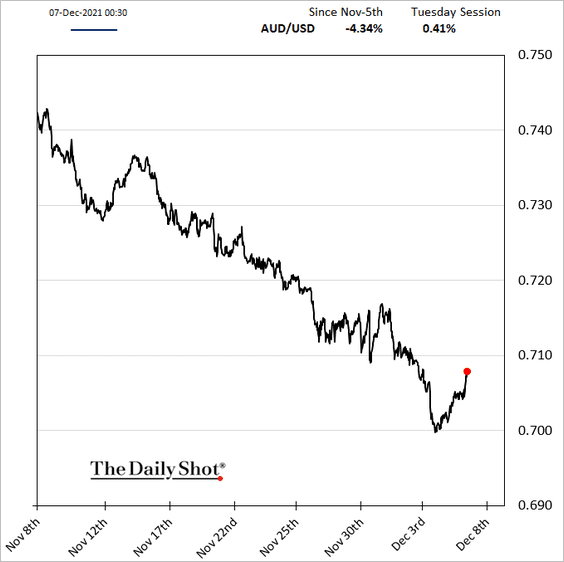
2. Next, we have some updates on Australia.
• As expected, the RBA left rates unchanged. Some analysts see the central bank ditching QE as soon as February.
The Aussie dollar found support at USD 0.70.
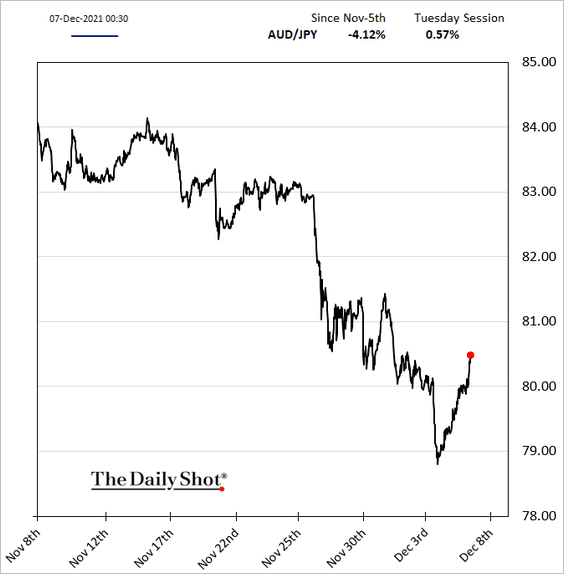
Here is Aussie-yen.
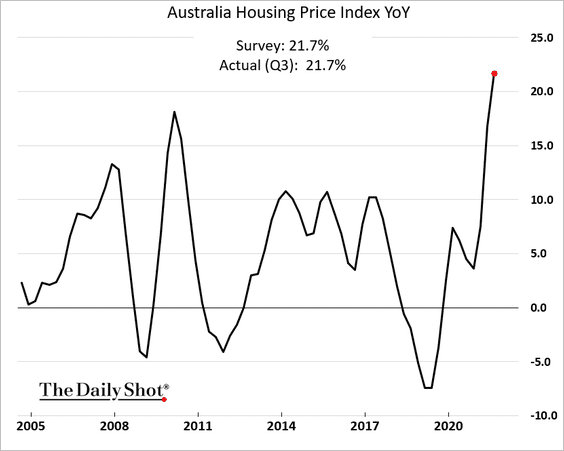
• Home price appreciation hit a record high.
• This chart shows household consumption as a share of GDP.
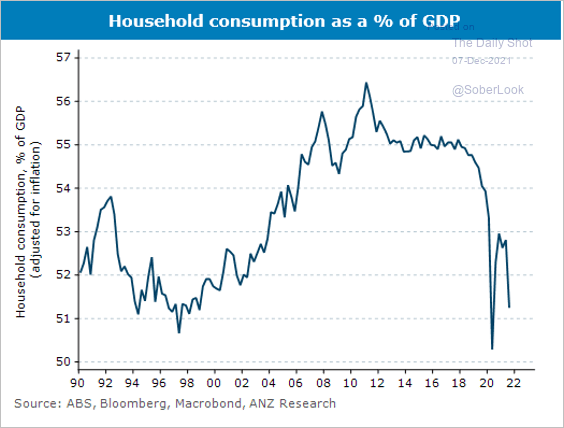 Source: @ANZ_Research, @AdelaideTimbrel
Back to Index
China
1. Despite all the bluster about staying the course on monetary policy, Beijing got spooked by the ramifications of the property sector credit crisis, especially Evergrande.
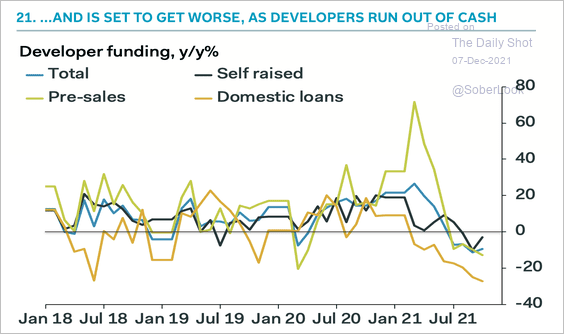 Source: Pantheon Macroeconomics
The PBoC went ahead and eased monetary policy by boosting liquidity in the financial system (cutting RRR).
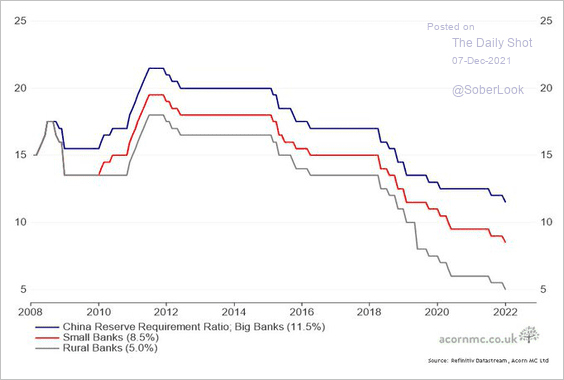 Source: @RichardDias_CFA
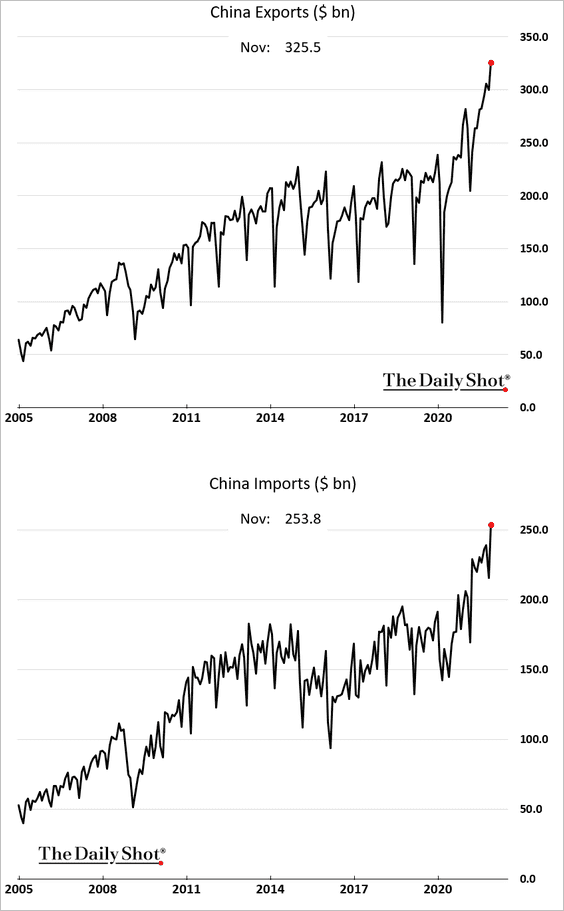
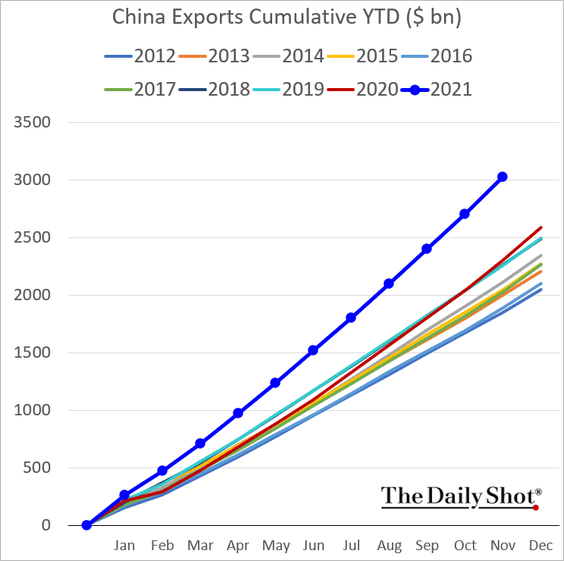
2. China’s exports hit another record high. And so did imports.
This chart shows cumulative year-to-date exports.
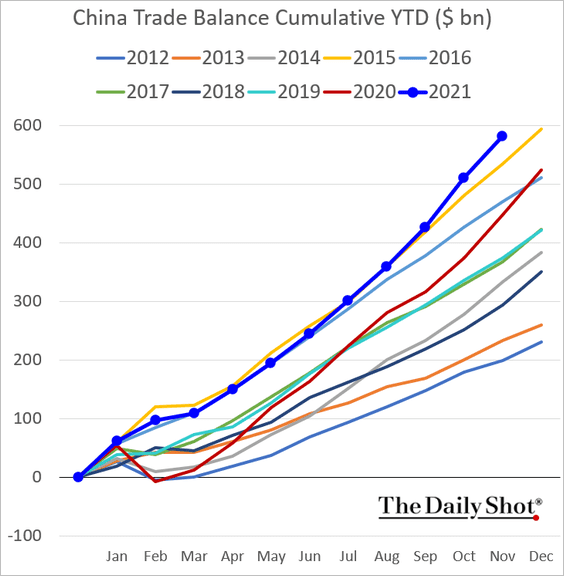
And here is the cumulative trade surplus.
——————–
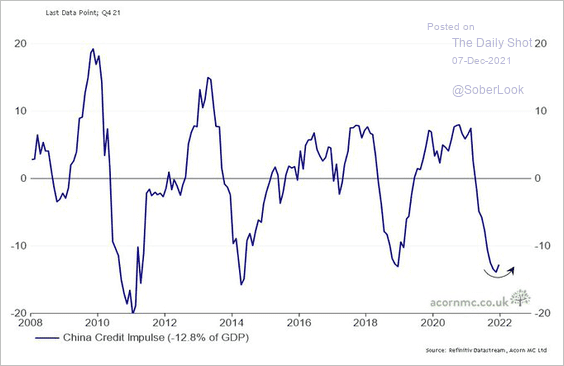
3. Has China’s credit impulse bottomed?
 Source: @RichardDias_CFA
Back to Index
Emerging Markets
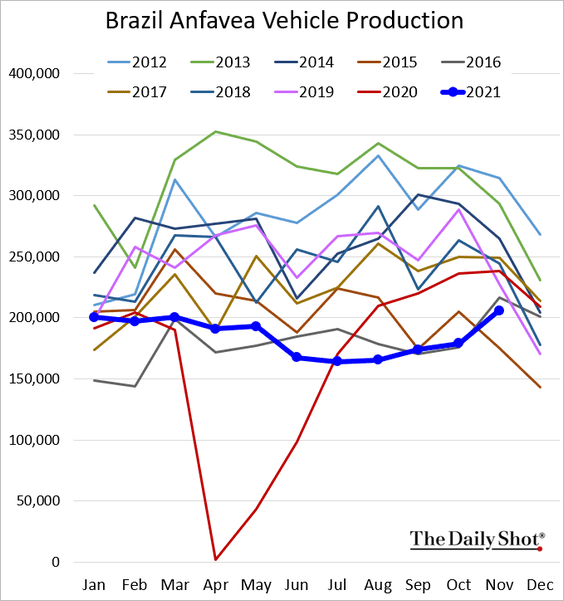
1. Brazil’s vehicle production seems to be recovering.
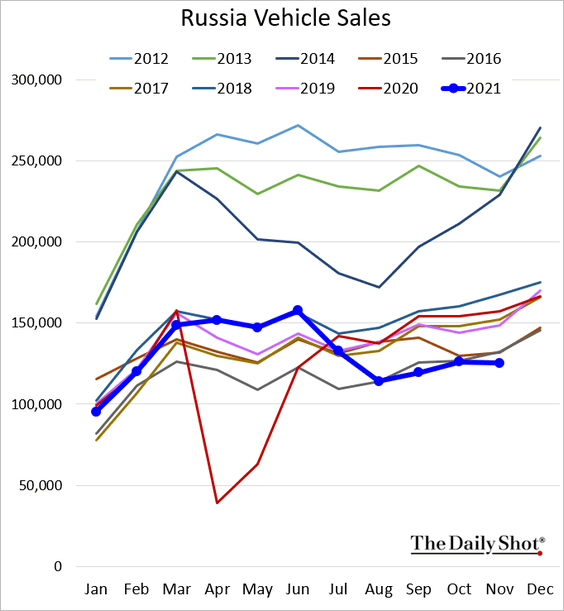
2. Russia’s vehicle sales remain depressed.
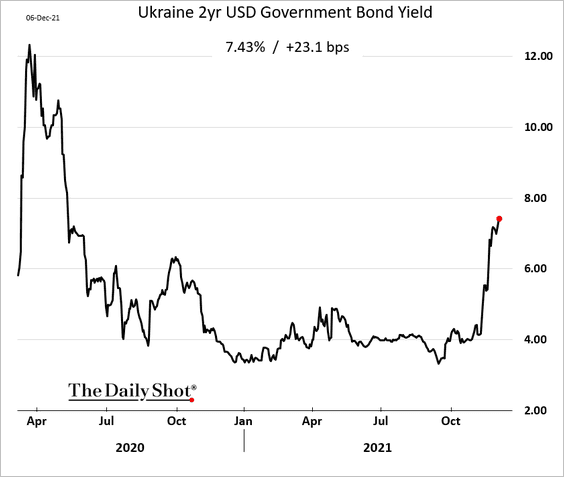
3. Ukraine’s bonds are selling off amid geopolitical uncertainty.
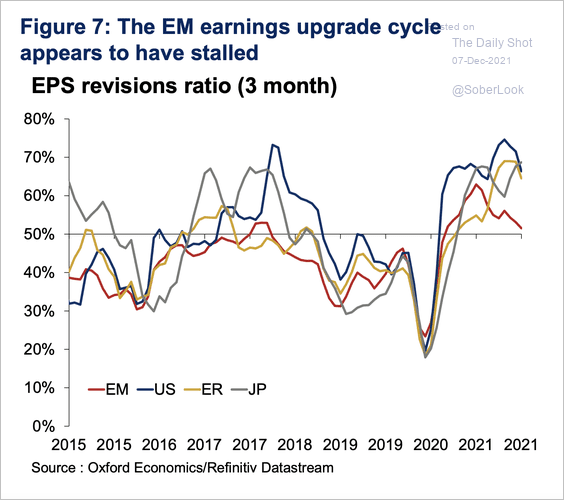
4. Emerging market earnings upgrade cycle has turned down.
 Source: Oxford Economics
5. MRB Partners expects global growth to outpace the previous cycle with EM in the lead.
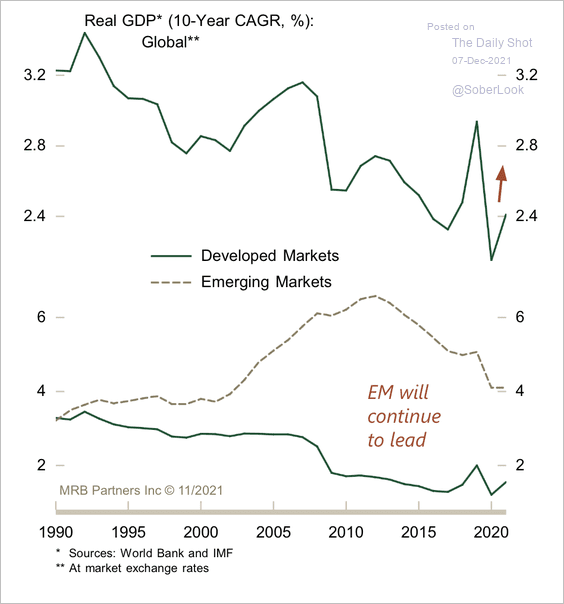 Source: MRB Partners
Back to Index
Cryptocurrency
1. Bitcoin declined nearly 30% from its all-time high of around $69K, which was the largest drawdown since September.
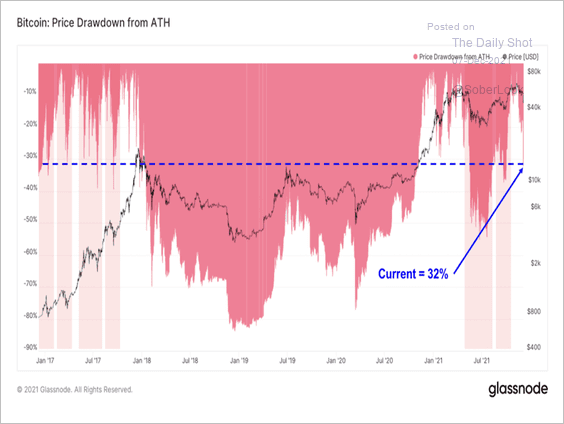 Source: Glassnode Read full article
2. Bitcoin’s trading volume was down for the second consecutive day as the BTC price stabilized around $50K.
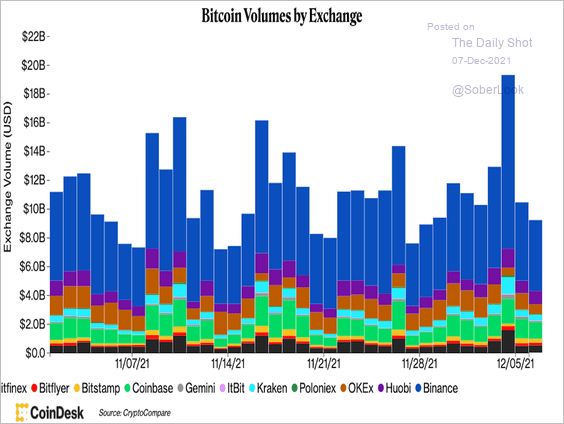 Source: CoinDesk Read full article
3. The weekend sell-off also triggered the largest one-day decline in BTC futures open interest since September 7th.
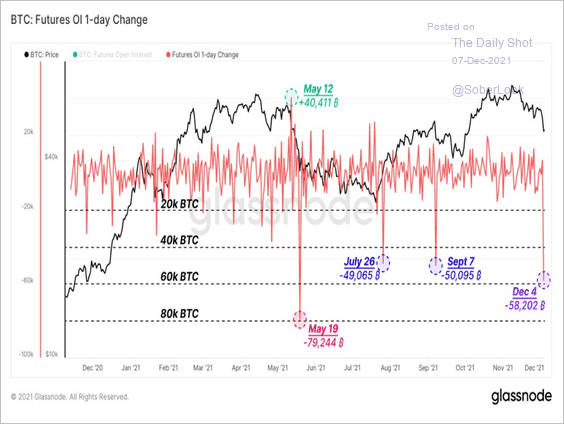 Source: @glassnode
4. Short-term bitcoin holders now account for a lower percentage of the total BTC supply.
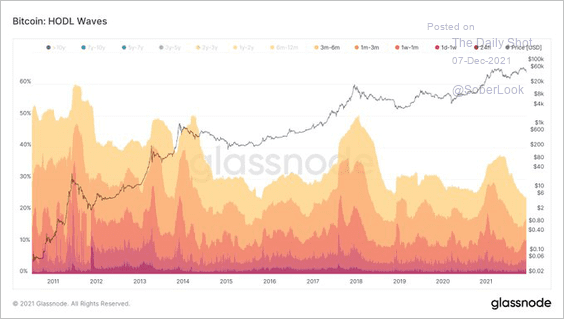 Source: Glassnode; @MichaelRinko
5. DeFi tokens have been under pressure.
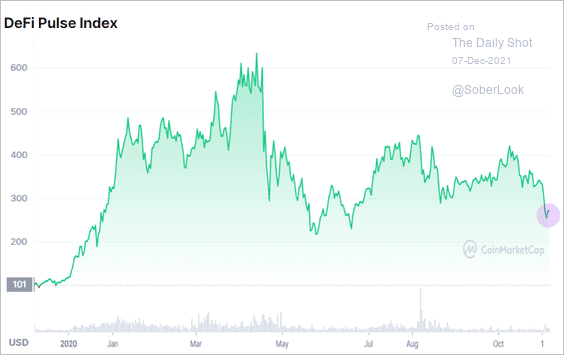 Source: CoinMarketCap
 Source: Bloomberg Read full article
Back to Index
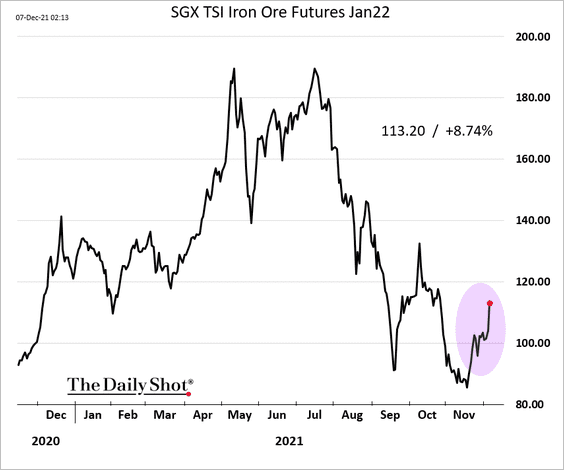
Commodities
1. Iron ore futures are rebounding.
2. There is a new regime in Asia’s gold imports in response to price changes.
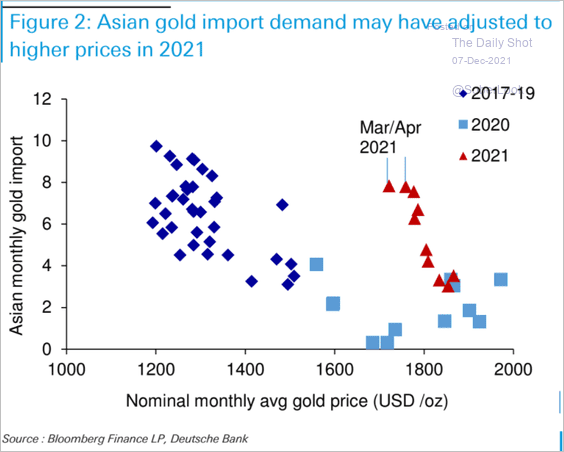 Source: Deutsche Bank Research
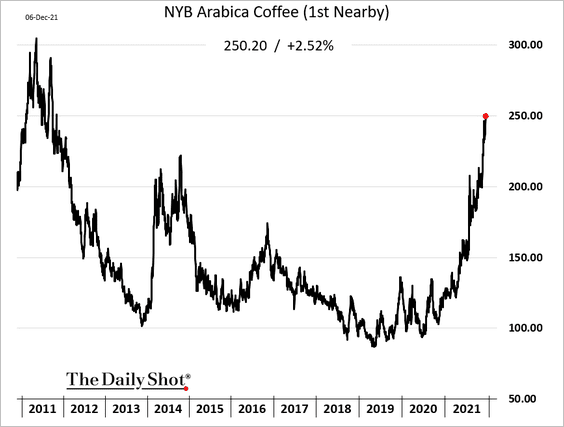
3. Coffee futures hit the highest level in over a decade.
4. US index traders have been unloading their corn and wheat positions.
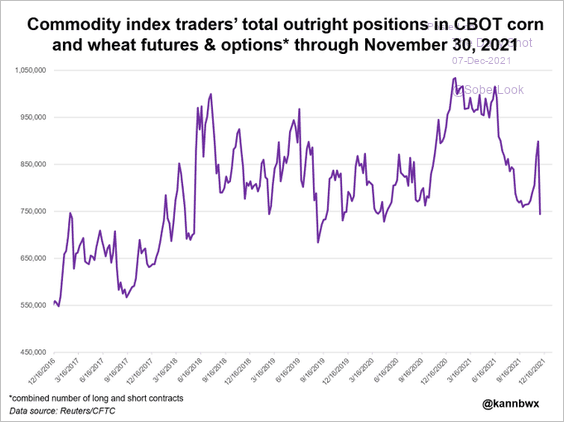 Source: @kannbwx
Back to Index
Energy
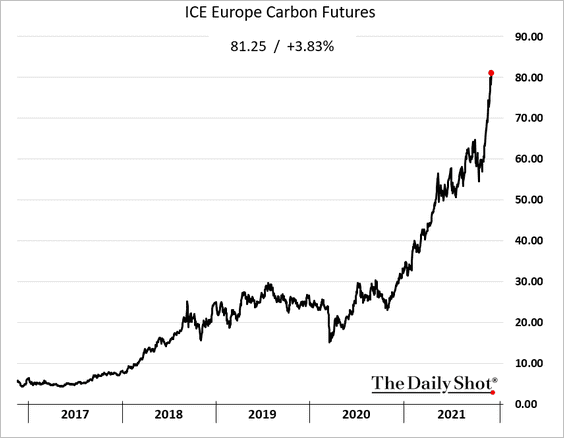
1. With European natural gas prices at exorbitant levels, coal plants will be burning coal through the winter. They are buying carbon allowances to stay in compliance with emissions restrictions. European carbon futures are soaring.
2. Brent is back above the 200-day moving average.
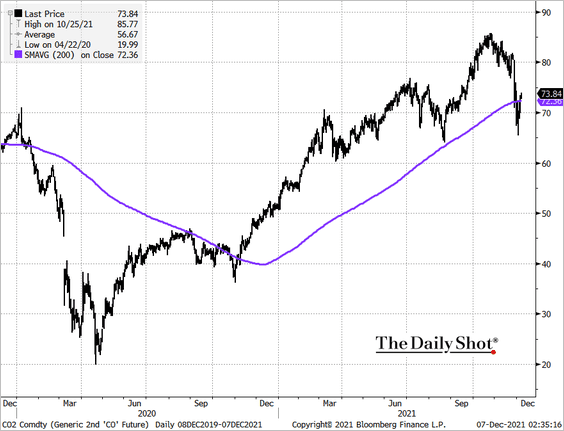 Source: @TheTerminal, Bloomberg Finance L.P.
3. Energy ETFs saw significant inflows in recent days.
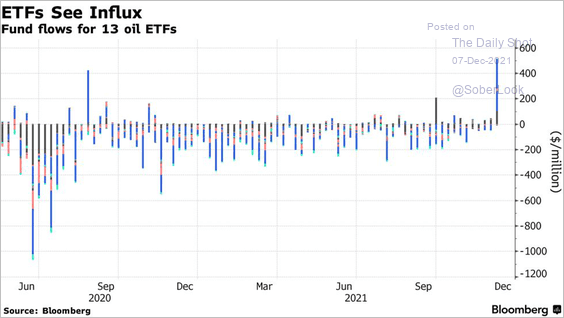 Source: @markets Read full article
4. US retail gasoline and gasoline futures have diverged sharply.
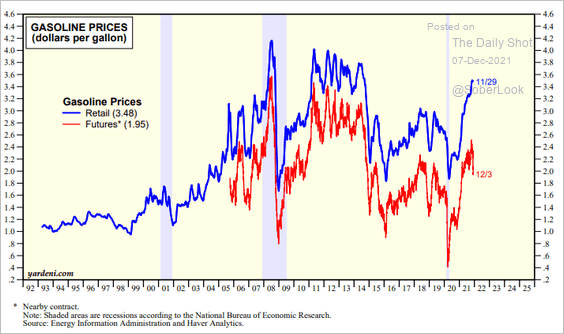 Source: Yardeni Research
Back to Index
Equities
1. Who needs the Fed put when we have the retail dip buyers’ put …
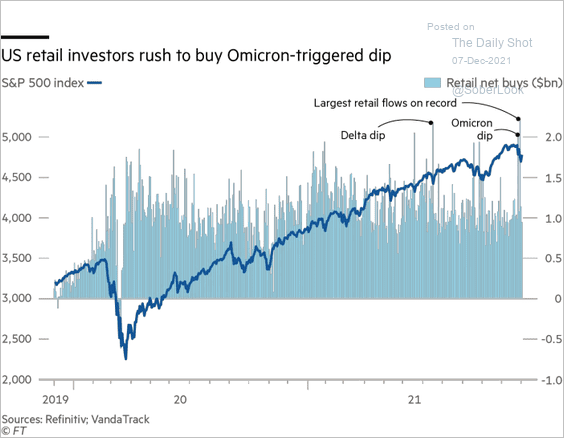 Source: @financialtimes Read full article
2. Here comes the Santa rally.
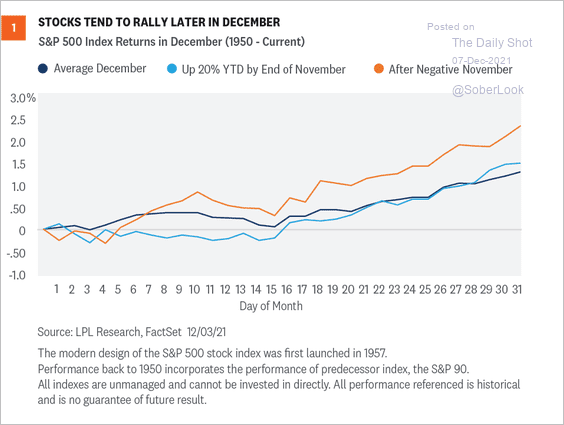 Source: LPL Research
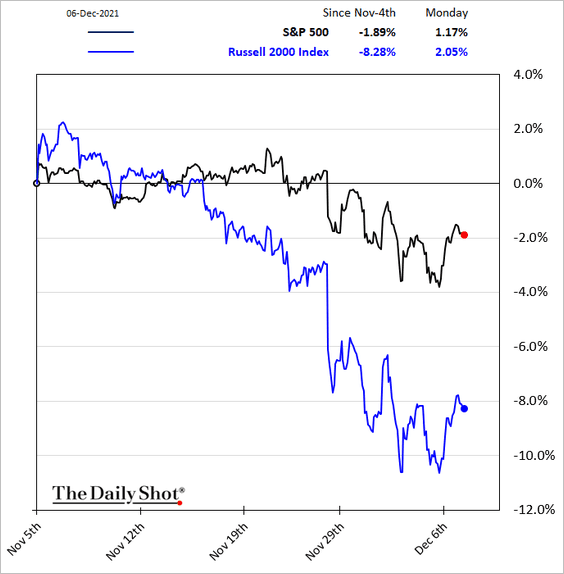
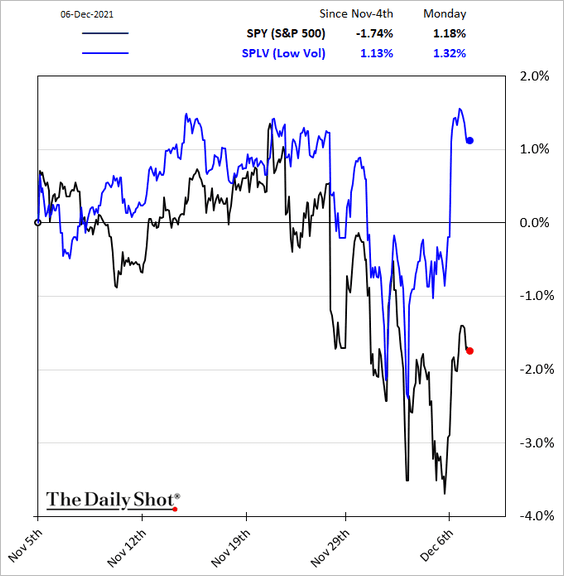
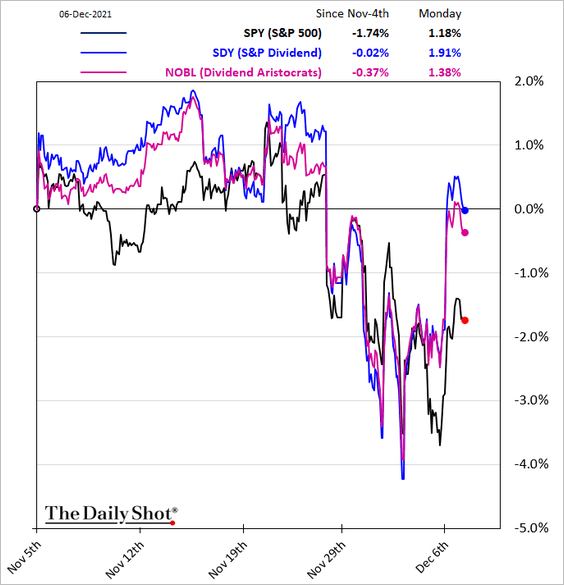
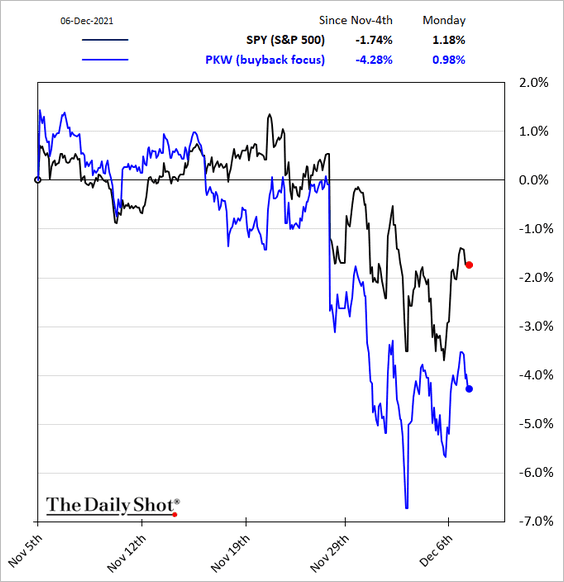
3. Let’s take a look at some equity factor/style trends.
• Small caps:
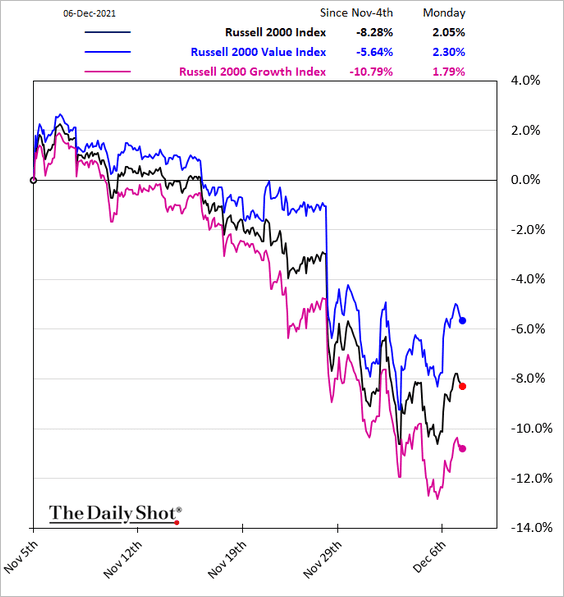
• Small-cap growth vs. value (value has been outperforming):
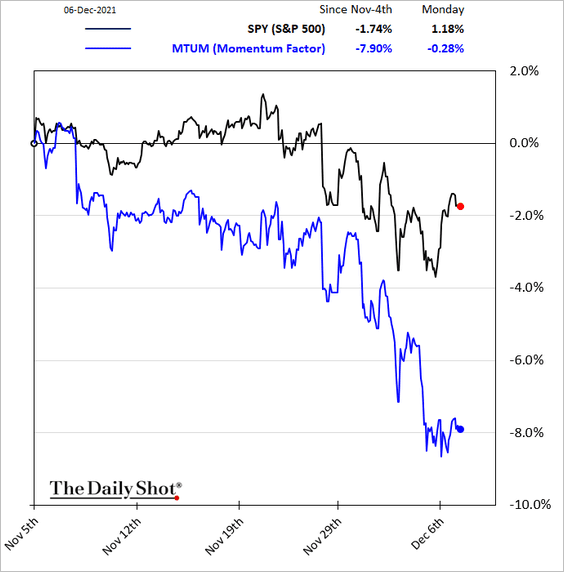
• Momentum:
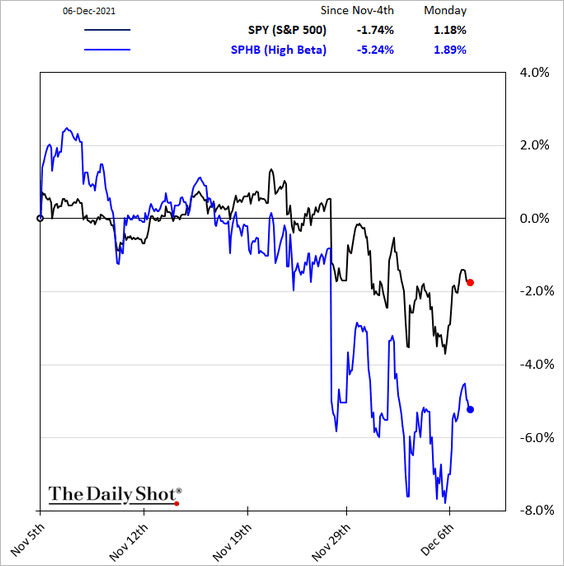
• High-beta:
• Low-vol:
• High-dividend and dividend growers:
• Companies known for share buybacks:
——————–
4. Mutual funds’ favorite stocks have outperformed retail favorites.
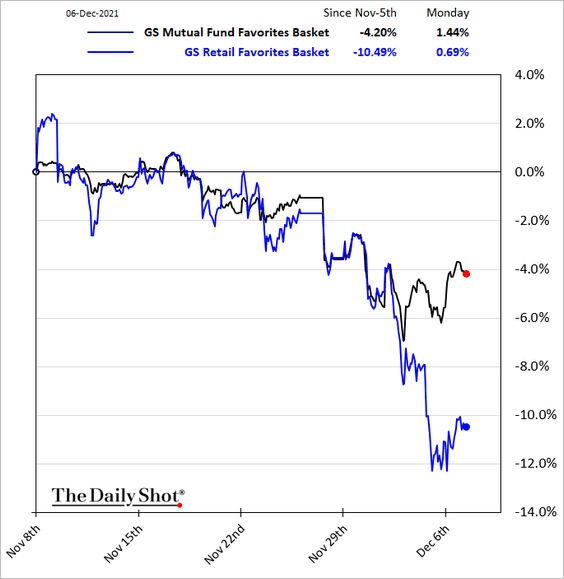 h/t @lena_popina
5. Goldman sees the S&P 500 at 5100 by the end of next year.
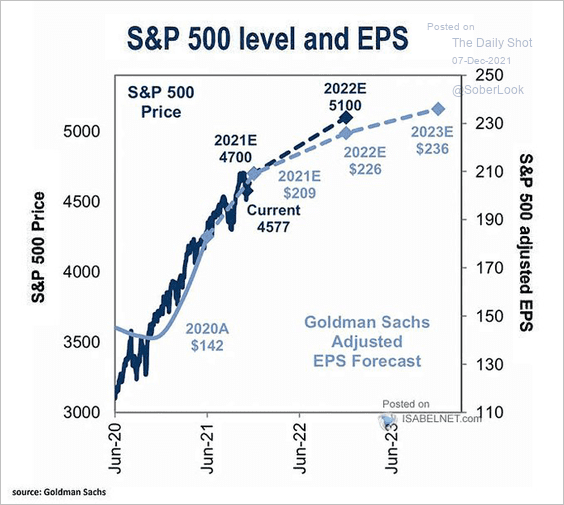 Source: @ISABELNET_SA, @GoldmanSachs
6. Private pension plans have largely maintained a 60/40 allocation to equities
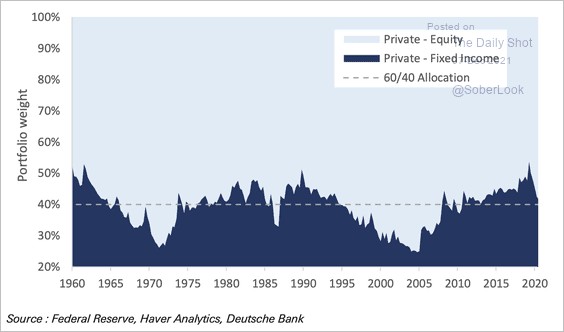 Source: Deutsche Bank Research
Public pension plans have spent the past 60 years rotating into equities, largely due to a rapid expansion of unfunded liabilities.
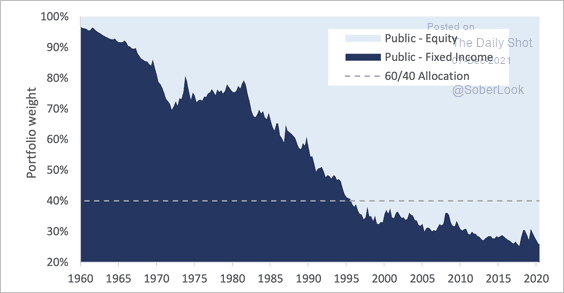 Source: Deutsche Bank Research
——————–
7. Demographics matter for very long-term stock returns.
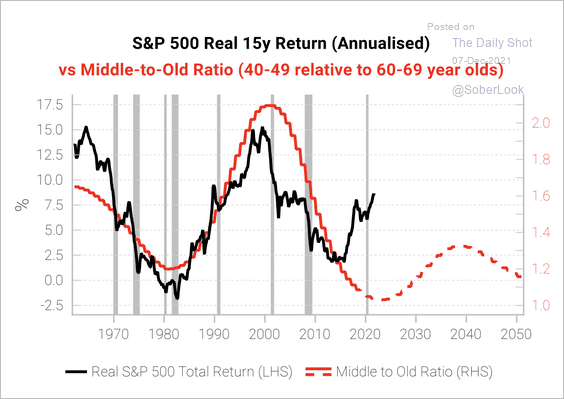 Source: Variant Perception
Back to Index
Rates
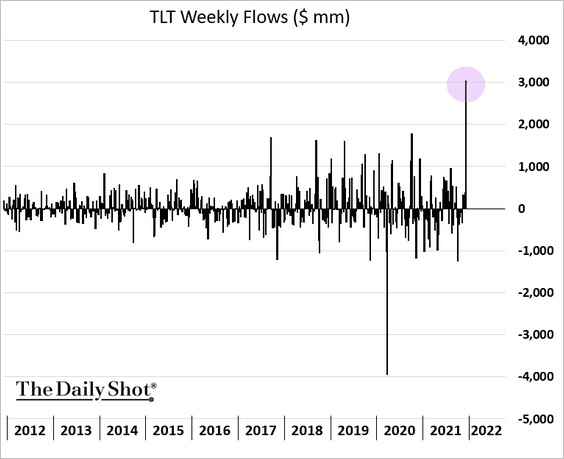
1. Flows into TLT (long-term Treasury ETF) hit a record high over the past few days.
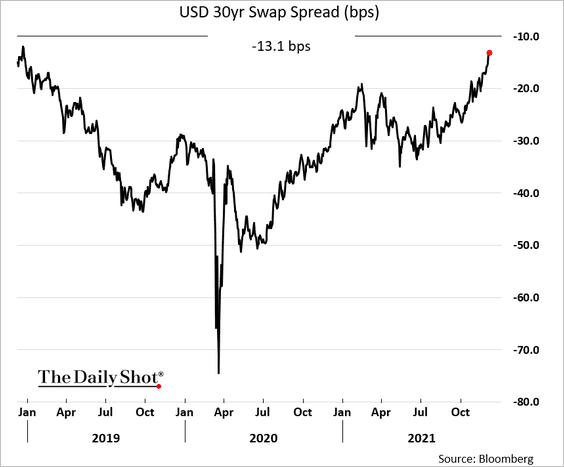
2. Longer-dated swap spreads have been climbing as the Treasury curve flattens.
——————–
Food for Thought
1. US federal government’s estate tax revenues:
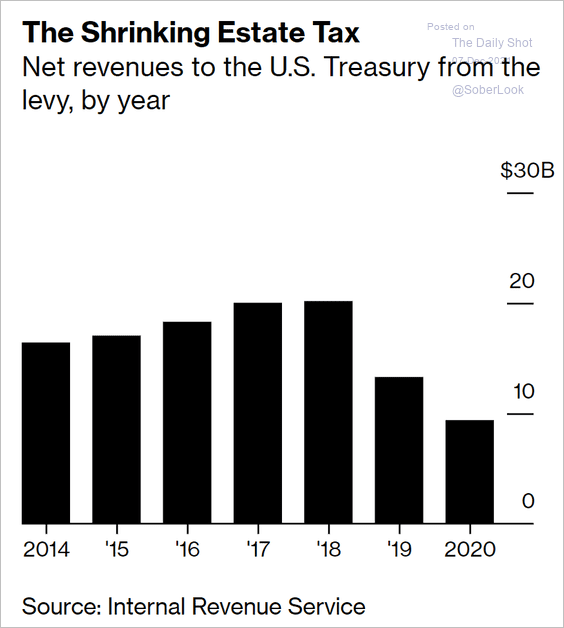 Source: Bloomberg Read full article
2. Wage growth polarization:
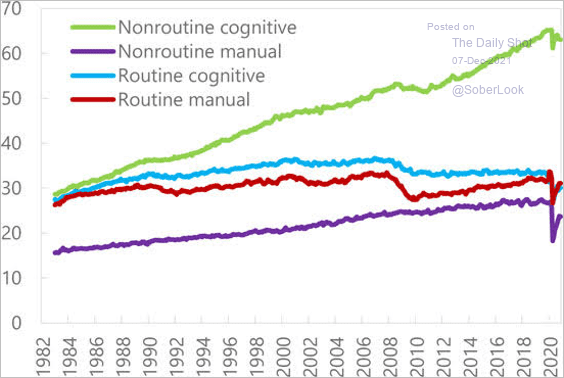 Source: IMF Read full article
3. Healthcare workers’ wage growth:
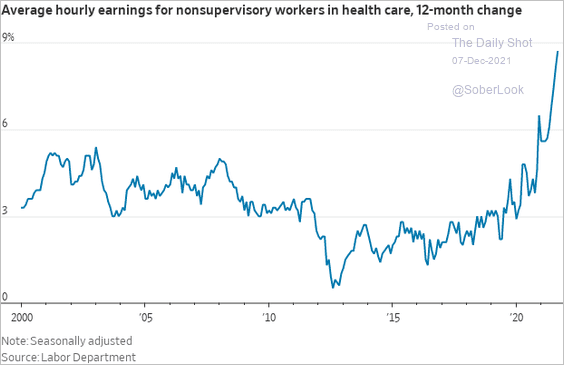 Source: @WSJ Read full article
4. Tech employees considering a job change:
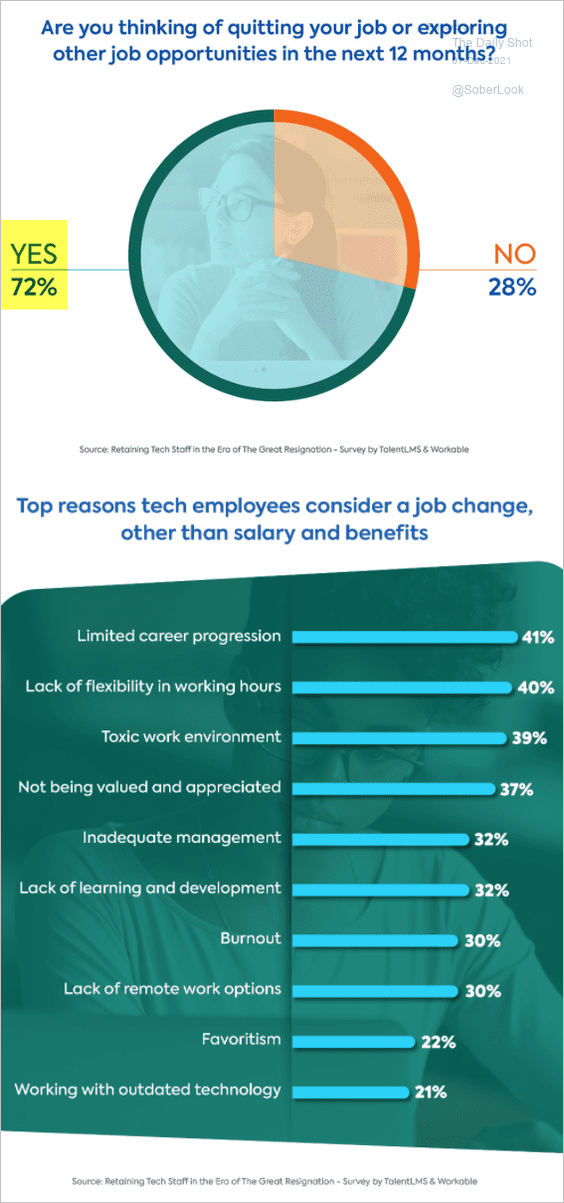 Source: TalentLMS Read full article
5. iPhone relative costs globally:
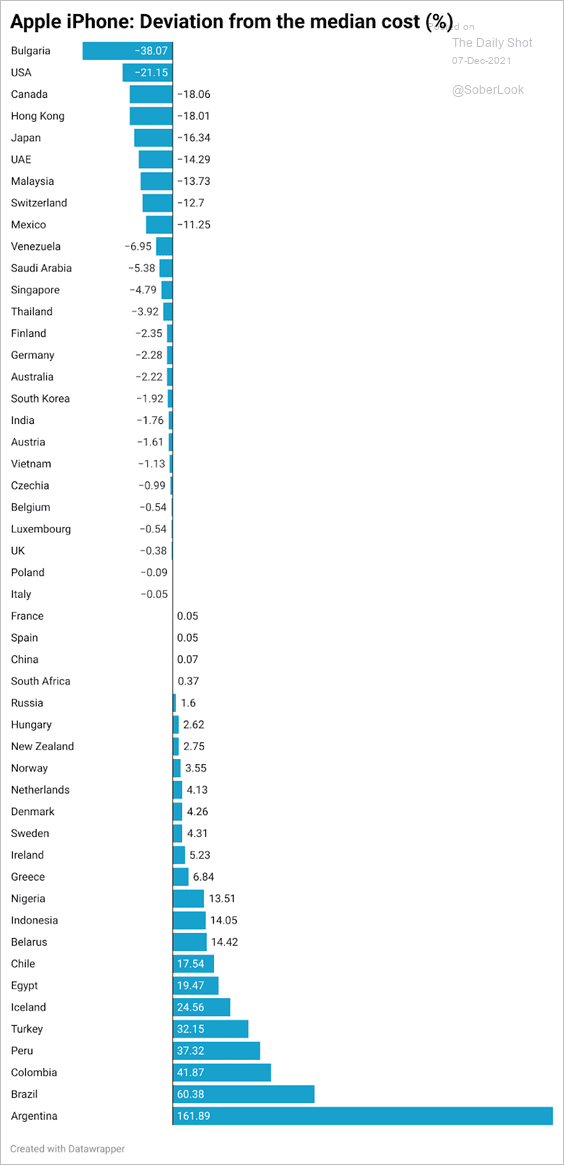 Source: Grover, The Electronics Price Index 2021 Read full article
6. Internet outages:
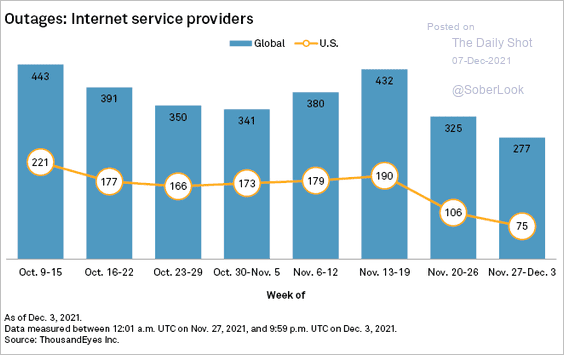 Source: @SPGMarketIntel Read full article
7. Personal income coming from government payments:
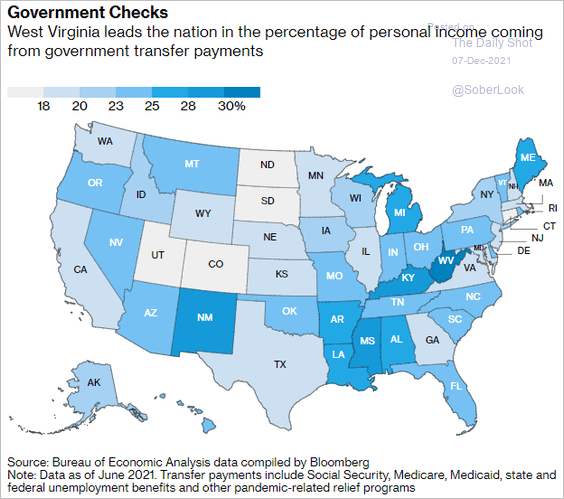 Source: @bpolitics Read full article
8. Inflation vs. omicron:
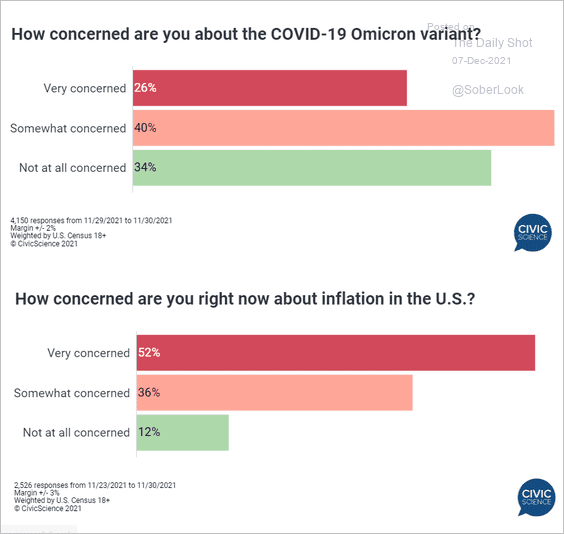 Source: @CivicScience
9. Becoming a pet owner during the pandemic:
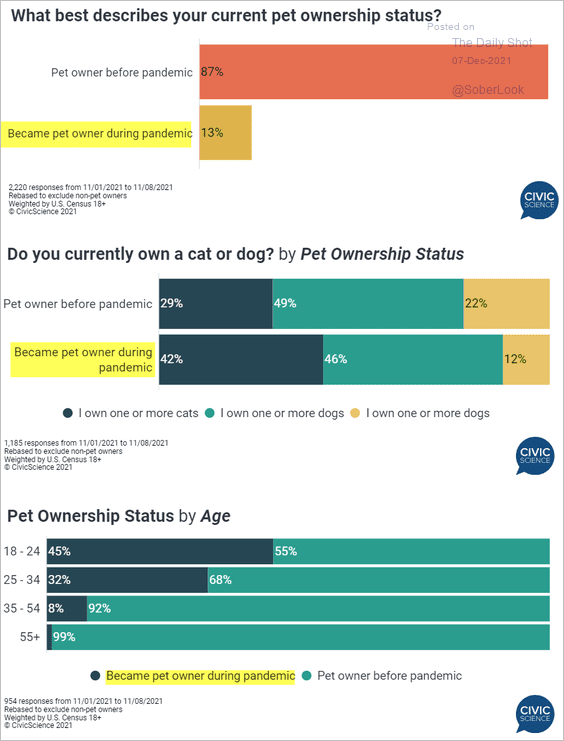 Source: @CivicScience Read full article
——————–
Back to Index