
I.
A friend recently sent us a chapter by Alicja Budnik and Maciej Henneberg, The Appearance of a New Social Class of Wealthy Commoners in the 19th and the Early 20th Century Poland and Its Biological Consequences, which appeared in the 2016 volume Biological Implications of Human Mobility.
A better title would be, Were Polish Aristocrats in the 1890s really that Obese?, because the chapter makes a number of striking claims about rates of overweight and obesity in Poland around the turn of the century, especially among women, and especially especially among the upper classes.
Budnik & Henneberg draw on data from historical sources to estimate height and body mass for men and women in different classes. The data all come from people in Poland in the period 1887-1914, most of whom were from Warsaw. From height and body mass estimates they can estimate average BMI for each of these groups. (For a quick refresher on BMI, a value under 18.5 is underweight, over 25 is overweight, and over 30 is obese.)
They found that BMIs were rather high; somewhat high for every class but quite high for the middle class and nobility. Peasants and working class people had average BMIs of about 23, while the middle class and nobles had average BMIs of just over 25.
This immediately suggests that more than half of the nobles and middle class were overweight or obese. The authors also estimate the standard deviation for each group, which they use to estimate the percentage of each group that is overweight and obese. The relevant figure for obesity is this:
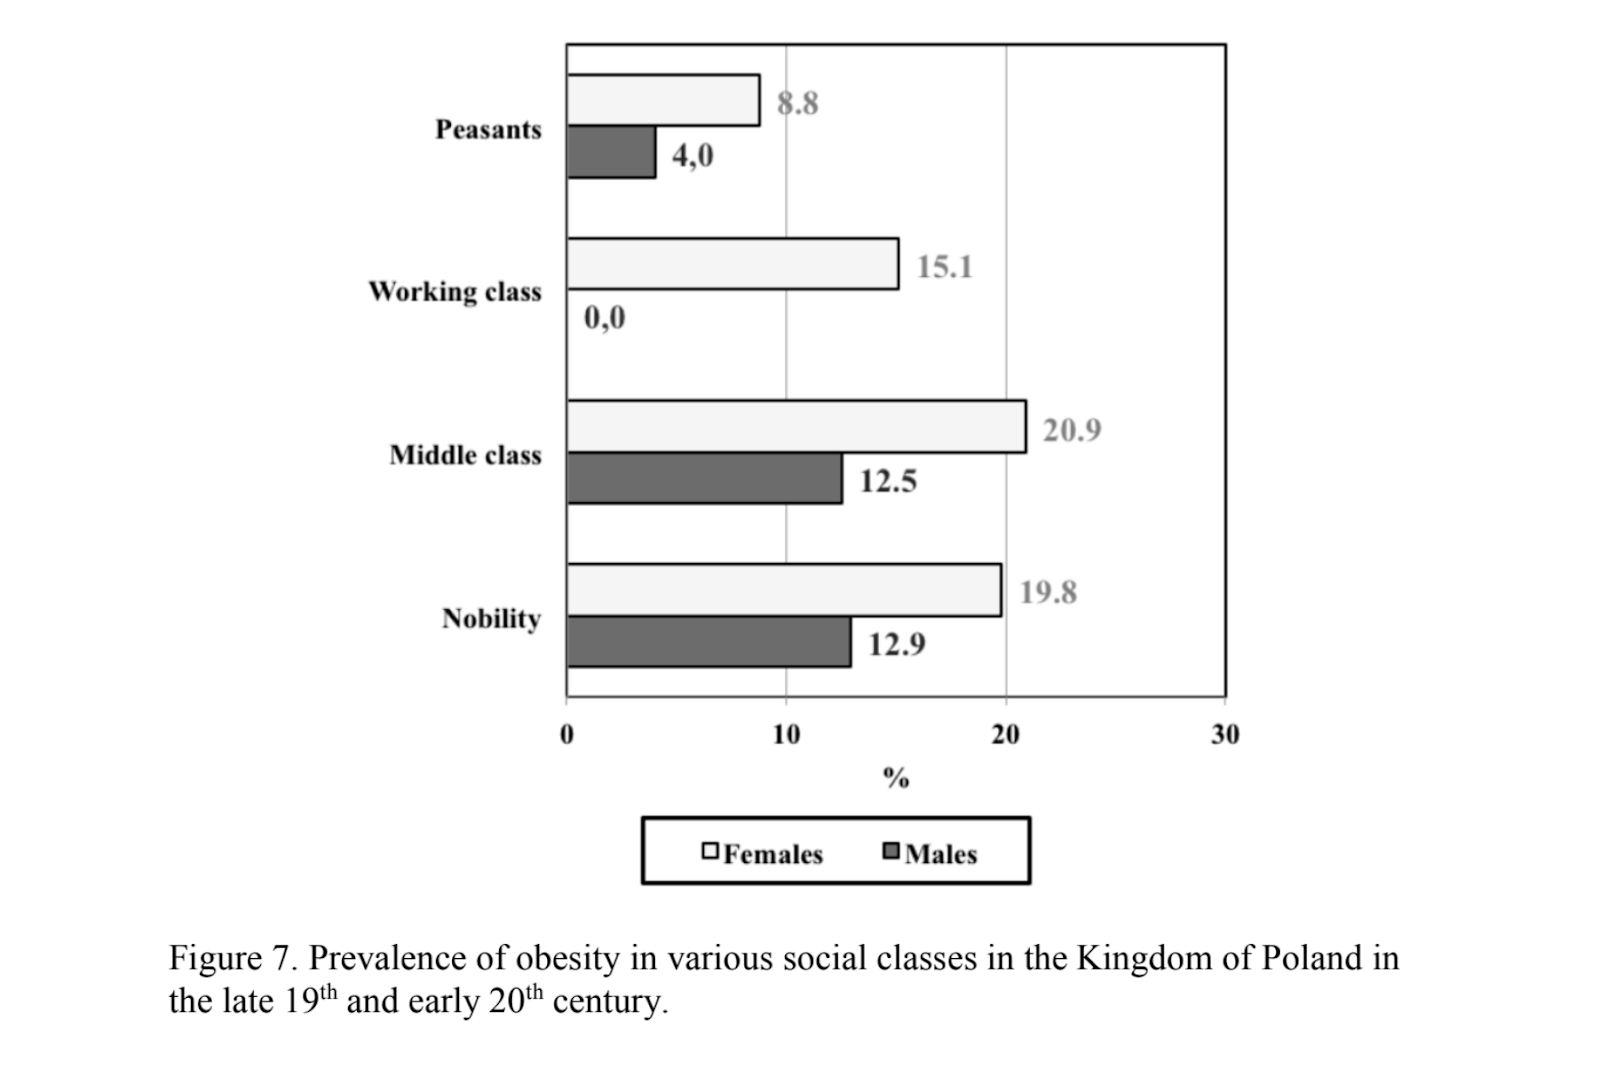
As you can see, the figure suggests that rates of obesity were rather high. Many groups had rates of obesity around 10%, while about 20% of middle- and upper-class women were obese.
This is pretty striking. One in five Polish landladies and countesses were obese? Are you sure?
To begin with, it contradicts several other sources on what baseline human weight would be during this period. The first is a sample of Union Army veterans examined by the federal government between 1890-1900. The Civil War was several decades before, so these men were in their 40s, 50s, and 60s. This is in almost the exact same period, and this sample of veterans was Caucasian, just like the Polish sample, but the rate of obesity in this group was only about 3%.
Of course, the army veterans were all men, and not a random sample of the population. But we have data from hunter-gatherers of both genders that also suggests the baseline obesity rate should be very low. As just one example, the hunter-gatherers on Kitava live in what might be called a tropical paradise. They have more food than they could ever eat, including potatoes, yams, fruits, seafood, and coconuts, and don’t exercise much more than the average westerner. Their rate of obesity is 0%. It seems weird that Polish peasants, also eating lots of potatoes, and engaged in backbreaking labor, would be so more obese than these hunter-gatherers.
On the other hand, if this is true, it would be huge for our understanding of the history of obesity, so we want to check it out.
Because this seems so weird, we decided to do a few basic sanity checks. For clarity, we refer to the Polish data as reported in the chapter by Budnik & Henneberg as the Warsaw data, since most (though not all) of these data come from Warsaw.
II.
The first sanity check is comparing the obesity rates in the Warsaw data to the obesity rates in modern Poland. Obesity rates have been rising since the 1890s [citation needed] so people should be more obese now than they were back then.
The Warsaw data suggests that men at the time were somewhere between 0% and 12.9% obese (mean of categories = 7.3%) and women at the time were between 8.8% and 20.9% obese (mean of categories = 16.2%). In comparison, in data from Poland in 1975, 7% of men were obese and 13% of women were obese. This suggests that obesity rates were flat (or perhaps even fell) between 1900 and 1975, which seems counterintuitive, and kinda weird.
In data from Poland in 2016, 24% of men were obese and 22% of women were obese. This also seems weird. It took until 2016 for the average woman in Poland to be as obese as a middle-class Polish woman from 1900? This seems like a contradiction, and since the more recent data is probably more accurate, it may mean that the Warsaw data is incorrect.
There’s another sanity check we can make. Paintings and photographs from the time period in question provide a record of how heavy people were at the time. If the Warsaw data is correct, there should be lots of photographs and paintings of obese Poles from this era. We checked around to see if we could find any, focusing especially on trying to get images of Poles from Warsaw.
We found a few large group photographs and paintings, and some pictures of individuals, and no way are 20% of them obese.
We begin with Sokrates Starynkiewicz, who was president of Warsaw from 1875 to 1892. He looks like a very trim gentleman, and if we look at this photograph of his funeral from 1902, we see that most of the people involved look rather trim as well:
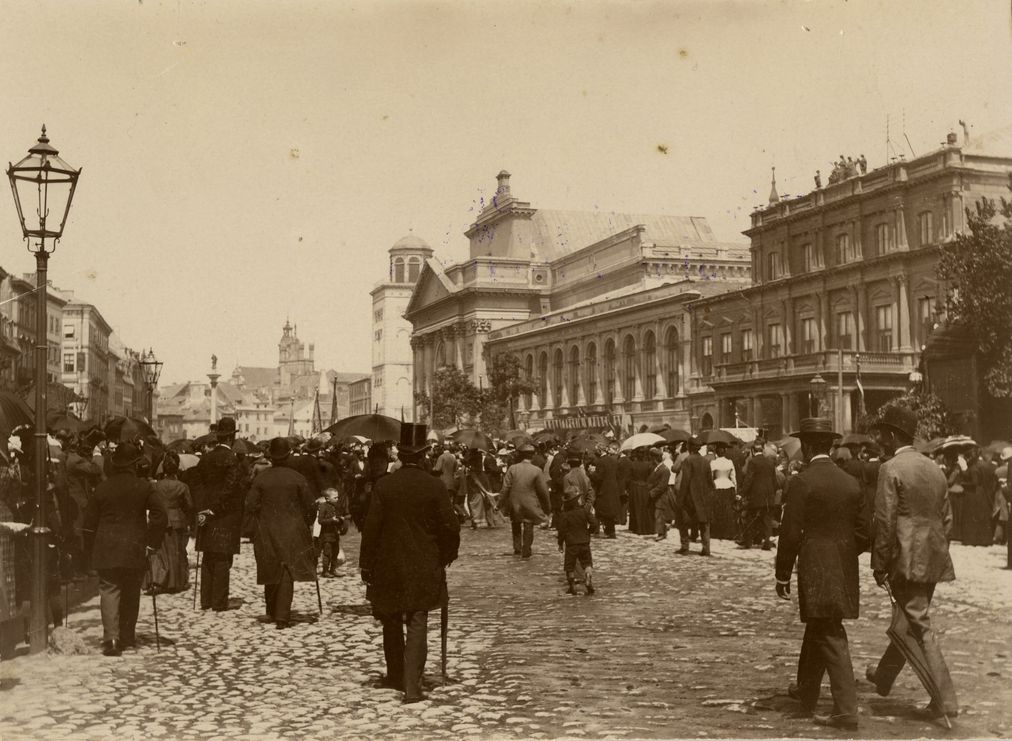
In addition, a photograph of a crowd from 1895:
And here’s a Warsaw street in 1905:
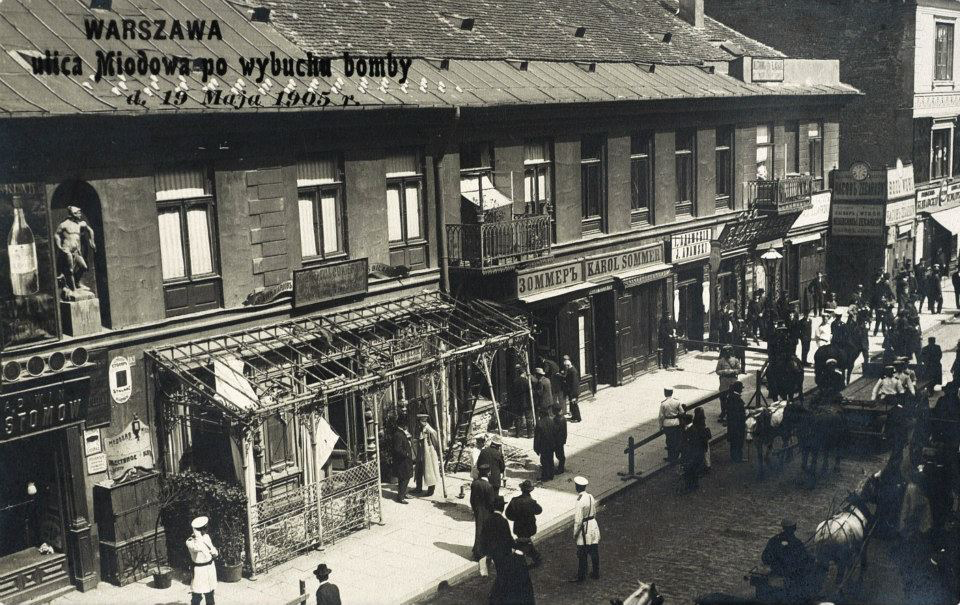
People in these photographs do not look very obese. But most of the people in these photographs are men, and the Warsaw data suggests that rates of obesity for women were more than twice as high.
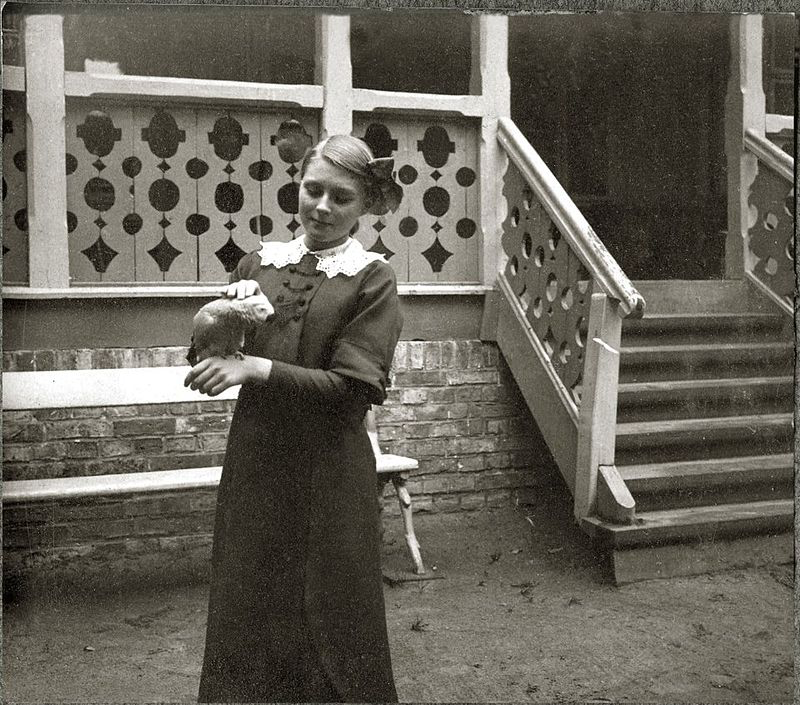
We decided to look for more photographs of women from the period, and found this list from the Krakow Post of 100 Remarkable Women from Polish History, many of whom seem to have been decorated soldiers (note to self: do not mess with Polish women). We looked through all of the entries for individuals who were adults during the period 1887-1914. There are photographs and/or portraits for many of them, but none of them appear to be obese. Several of them were painters, but none of the subjects of their paintings appear obese either. (Unrelatedly, one of them dated Charlie Chaplin and also married a Count and a Prince.)
If rates of obesity were really 20% for middle and upper class women, then there should be photographic evidence, and we can’t find any. What we have found is evidence that Polish women are as beautiful as they are dangerous, which is to say, extremely.

III.
If we’re skeptical of the Warsaw data, we have to wonder if there’s something that could explain this discrepancy. We can think of three possibilities.
The first is that we have a hard time imagining that whoever collected this data got all these 19th-century Poles to agree to be weighed totally naked. If they were wearing all of their clothes, or any of their clothes, that could explain the whole thing. (It might also explain the large gender and class effects.)
Clothing weighed a lot back then. Just as one example, a lady’s dolman could weigh anywhere between 6 and 12 pounds, and a skirt could weigh another 12 pounds by itself. We found another source that suggested a lady’s entire outfit in the 1880s (though not Poland specifically) would weigh about 25 lbs.
As far as we can tell, there’s no mention of clothes, clothing, garments, shoes, etc. in the chapter, so it’s quite possible they didn’t account for clothing at all. All the original documents seem to be in Polish and we don’t speak Polish, so it’s possible the original authors don’t mention it either. (If you speak Polish and are interested in helping unravel this, let us know!)
Also, how did you even weigh someone in 1890s Poland? Did they carry around a bathroom scale? We found one source that claims the first “bathroom” scale was introduced in 1910, but they must have been using something in 1890.
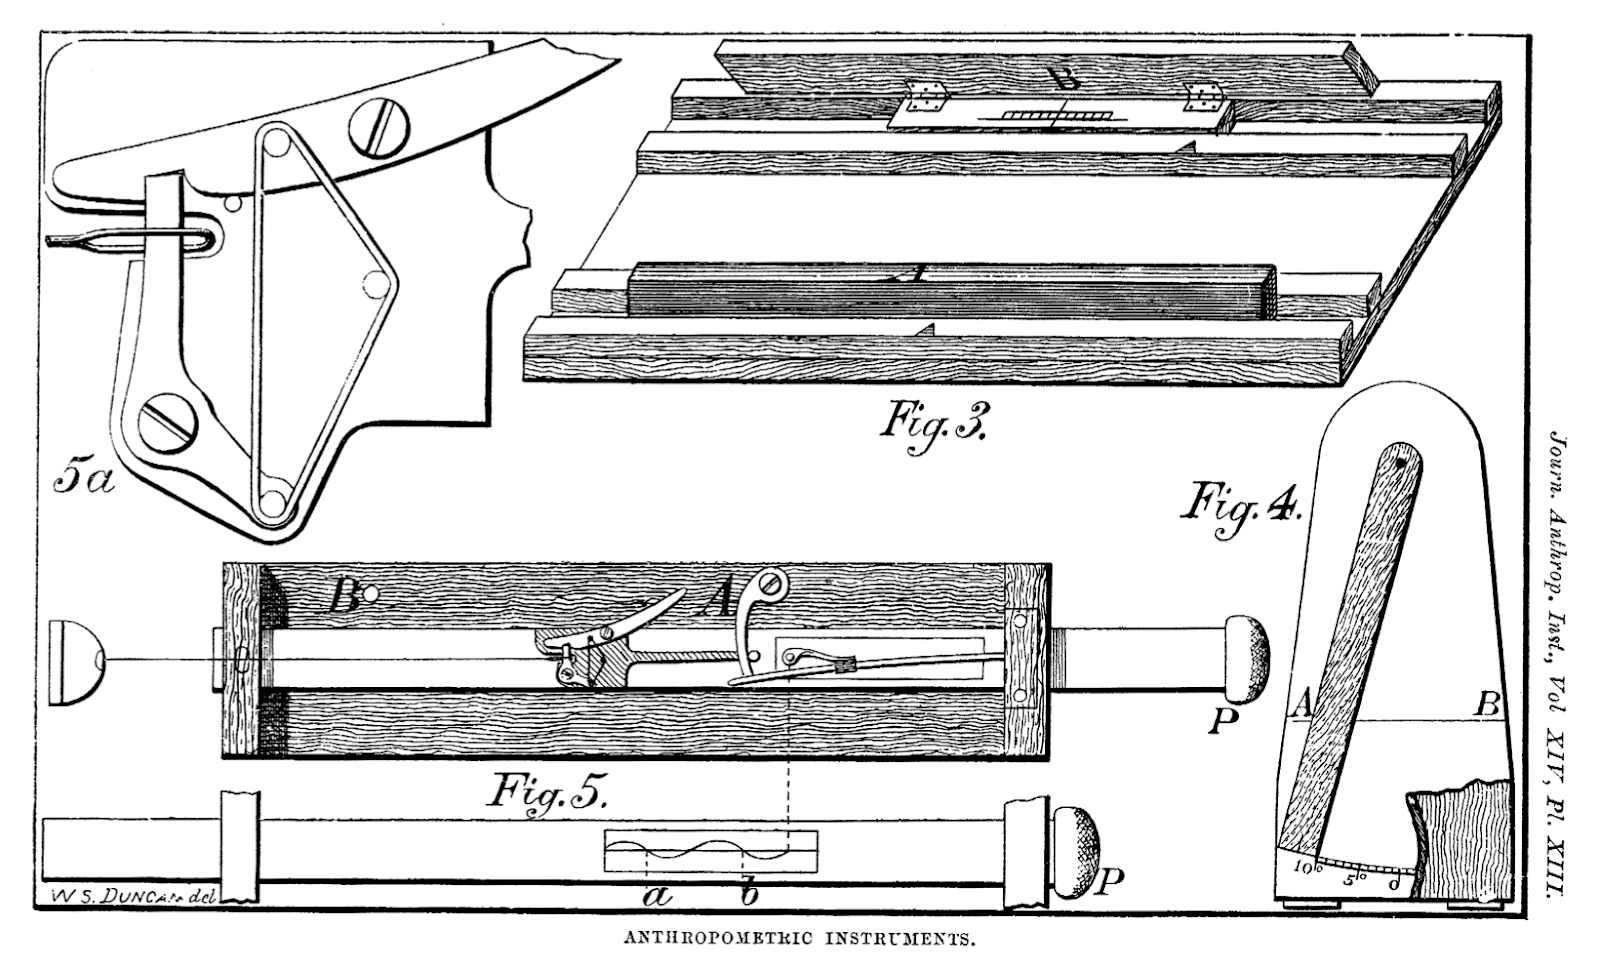
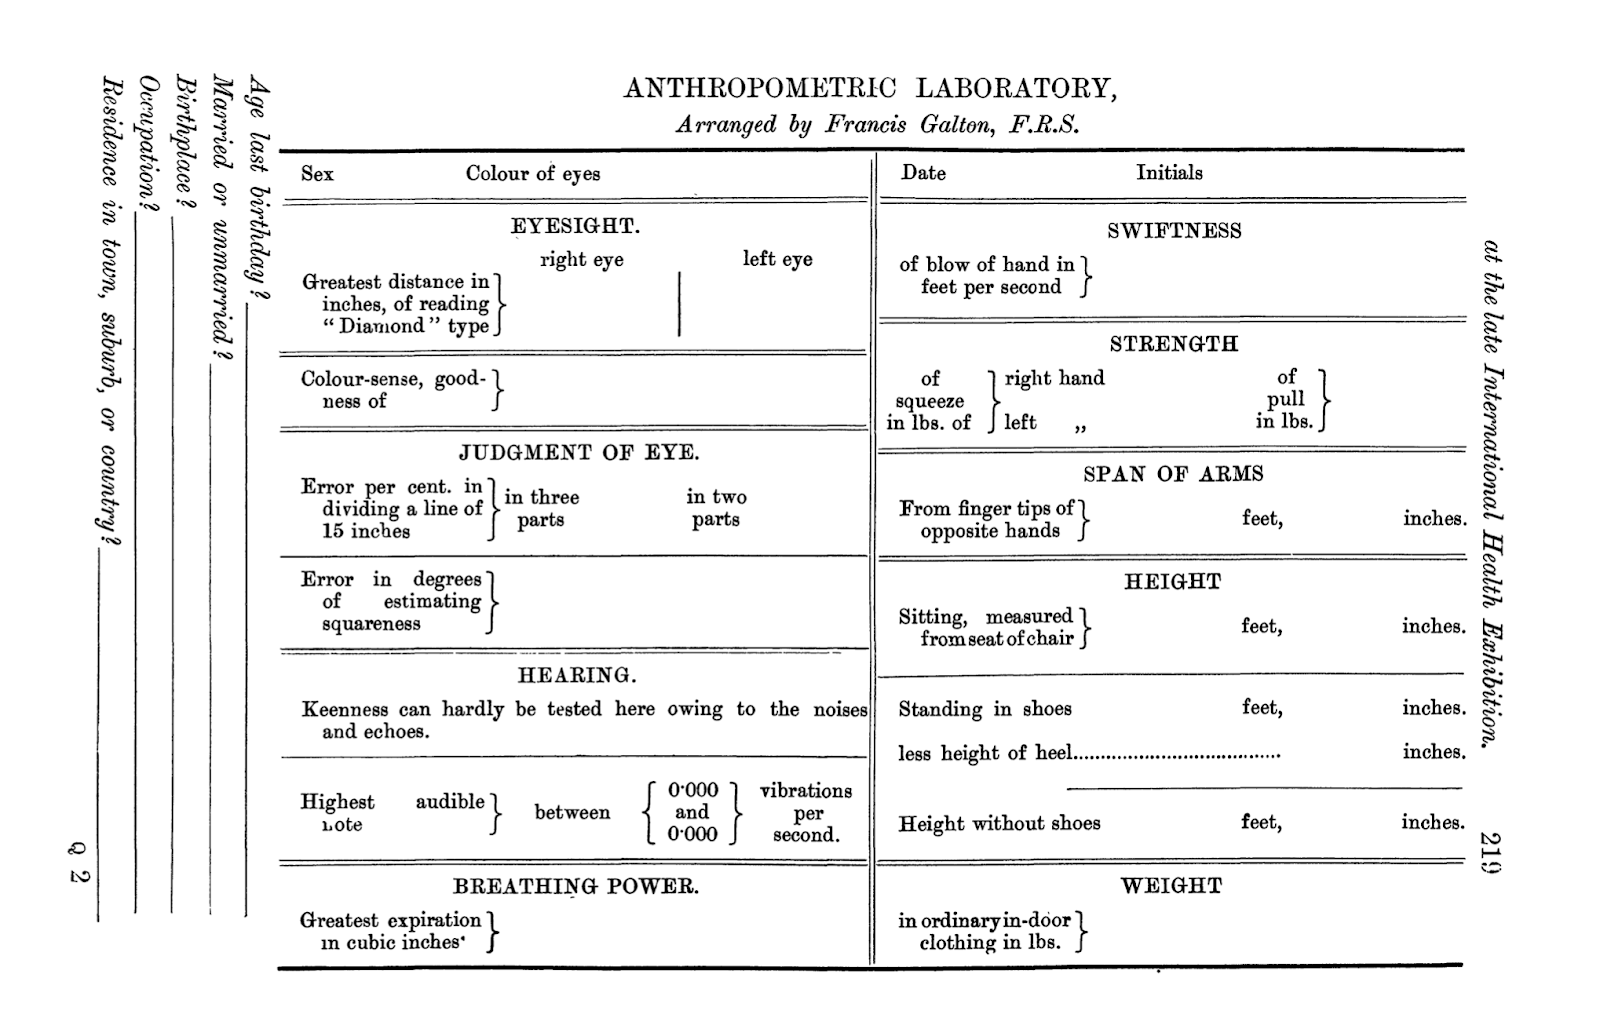
Sir Francis Galton, who may have come up with the idea of weighing human beings, made some human body weight measurements in 1884 at London’s International Health Exhibition. He invited visitors to fill out a form, walk through his gallery, and have their measurements taken along a number of dimensions, including colour-sense, depth perception, sense of touch, breathing capacity, “swiftness of blow with fist”, strength of their hands, height, arm span, and weight. (Galton really wanted to measure the size of people’s heads as well, but wasn’t able to, because it would have required ladies to remove their bonnets.) In the end, they were given a souvenir including their measurements. To take people’s weights, Galton describes using “a simple commercial balance”.
Galton also specifically says, “Overcoats should be taken off, the weight required being that of ordinary indoor clothing.” This indicates he was weighing people in their everyday clothes (minus only overcoats), which suggests that the Polish data may also include clothing weight. “Stripping,” he elaborates, “was of course inadmissible.”
Also of interest may be Galton’s 1884 paper, The Weights of British Noblemen During the Last Three Generations, which we just discovered. “Messrs. Berry are the heads of an old-established firm of wine and coffee merchants,” he writes, “who keep two huge beam scales in their shop, one for their goods, and the other for the use and amusement of their customers. Upwards of 20,000 persons have been weighed in them since the middle of last century down to the present day, and the results are recorded in well-indexed ledgers. Some of those who had town houses have been weighed year after year during the Parliamentary season for the whole period of their adult lives.”
Naturally these British noblemen were not being weighed in a wine and coffee shop totally naked, and Galton confirms that the measurements should be, “accepted as weighings in ‘ordinary indoor clothing’.” This seems like further evidence that the Warsaw data likely included the weight of individuals’ clothes.
Another explanation has to do with measurements and conversions. Poland didn’t switch to the metric system until after these measurements were made (various sources say 1918, 1919, 1925, etc.), so some sort of conversion from outdated units has to be involved. This chapter does recognize that, and mentions that body mass was “often measured in Russian tsar pounds (1 kg = 2.442 pounds).”
We have a few concerns. First, if it was “often” measured in these units, what was it measured in the rest of the time?
Second, what is a “Russian tsar pound”? We can’t find any other references for this term, or for “tsar pound”, but we think it refers to the Russian funt (фунт). We’ve confirmed that the conversion rate for the Russian funt matches the rate given in the chapter (409.5 g, which comes out to a rate of 2.442 in the opposite direction), which indicates this is probably the unit that they meant.
But we’ve also found sources that say the funt used in Warsaw had a different weight, equivalent to 405.2 g. Another source gives the Polish funt as 405.5 g. In any case, the conversion rate they used may be wrong, and that could also account for some of the discrepancy.
The height measurements might be further evidence of possible conversion issues. The authors remark on being surprised at how tall everyone was — “especially striking is the tallness of noble males” — and this could be the result of another conversion error. Or it could be another side effect of clothing, if they were measured with their shoes on, since men’s shoes at the time tended to have a small heel. (Galton measured height in shoes, then the height of the heel, and subtracted the one from the other, but we don’t know if the Polish anthropometers thought to do this.)
A third possibility is that the authors estimated the standard deviation of BMI incorrectly. To figure out how many people were obese, they needed not only the mean BMI of the groups, they needed an estimate of how much variation there was. They describe their procedure for this estimation very briefly, saying “standard deviations were often calculated from grouped data distributions.” (There’s that vague “often” again.)
What is this technique? We don’t know. To support this they cite Jasicki et al. (1962), which is the book Zarys antropologii (“Outline of Anthropology”). While we see evidence this book exists, we can’t find the original document, and if we could, we wouldn’t be able to read it since we don’t speak Polish. As a result, we’re concerned they may have overestimated how much variation there was in body weights at the time.
These three possibilities seem sufficient to explain the apparently high rates of obesity in the Warsaw data. We think the Warsaw data is probably wrong, and our best guess for obesity rates in the 1890s is still in the range of 3%, rather than 10-20%.

You know, it’s not to say that I’m particularly sold on the Warsaw data, but when you mentioned surprise at the idea that 1970s Poles might have been thinner than 1890s Poles, all I could think was. Erm. Have you looked at the history of Poland in the 20th century lately? They seemed to spend the better part of it being oppressed by either the Nazis or the Russians. I would find it totally unsurprising for them to have come out of it somewhat malnourished compared to the pre-war averages.
LikeLike
Hey, that was super interesting, thanks! I also happen to be a native speaker of Polish and would be happy to try to help you out with the Polish literature. Let me know what would you need to check exactly.
LikeLike