- India
- International
Wednesday, May 01, 2024
Journalism of Courage
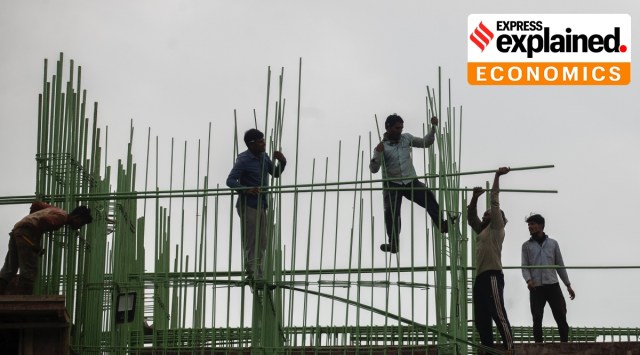 Laborers work at a building construction site in Mumbai, Tuesday, Nov. 30, 2021. (AP Photo/Rafiq Maqbool)
On Tuesday, the government released the economic growth data for the second quarter — July, August and September — of the current financial year. Accordingly, India’s Gross Domestic Product (GDP) — which measures economic activity from the demand side by looking at the expenditures made by different sections of the society — was 8.4% more than it was in the same quarter last year. India’s Gross Value Added (GVA) — which measures economic activity from the supply side by looking at the value added by different sectors of the economy — was 8.5% more than it was in the same quarter last year.
However, given the fact that the Indian economy, much like most other economies, suffered a massive contraction in the last financial year (2020-21), it is better to avoid looking at growth rates and instead look at absolute levels of economic activity. Doing so allows for a better understanding of where the economy stands vis-a-vis the pre-Covid level.
The GDP is essentially the sum total of
* All the money that Indians spend as private individuals spend [C],
* All the money that the government spends [G]
* All the money that businesses spend (or invest) [I]
* The net effect of exports (what foreigners spend on our goods) and imports (what Indians spend on foreign goods) [NX].
Table 1 shows the Q2 GDP data in absolute terms for the last five years.

This year, private consumption (which accounts for 55% of all GDP and is the biggest engine of growth) grew by 8.6% over Q2 of last year. But this growth was inadequate because in Q2 last year, private consumption expenditure contracted by more than 11%. As such, as the table shows, private consumption in Q2 this year was significantly lower than it was in the same quarter two years ago. In simple terms, people spent less this year than they did in the same quarter two years ago.
In contrast, the investments made by businesses — which is the second biggest engine of GDP growth, accounting for 33% of all GDP — in Q2 grew handsomely by 11%, easily overhauling the contraction of 8.6% last year. In fact, firms made more investments in this Q2 than in any Q2 over the last five years. This shows that firms were optimistic about India’s economic recovery.
The third key takeaway pertains to the government’s expenditures. As the data show, barring last year which was an exceptional year, the government’s expenditure is the lowest in five years. This shows that at a time when private demand is struggling to recover, the government has not been able to plug the gap.
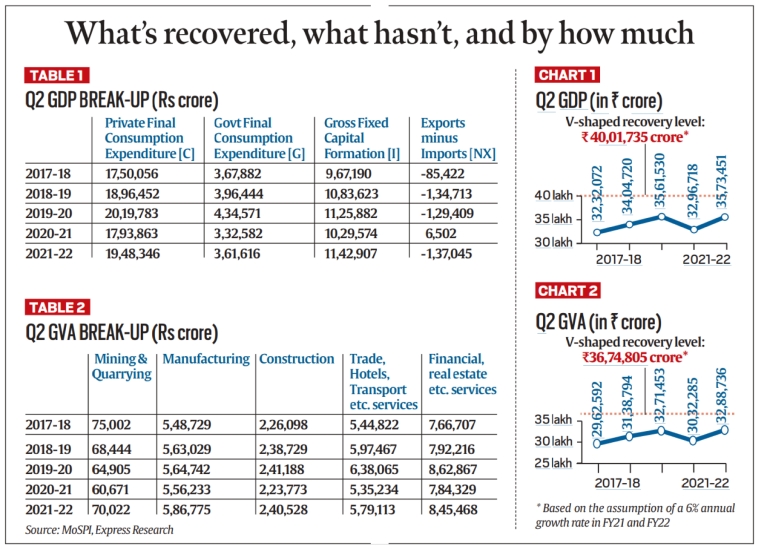 What’s recovered, what hasn’t and by how much
While GDP is the preferred variable for measuring growth, the fact is that GDP is “derived” by taking the GVA data and adding the taxes earned by the government on different products and then subtracting all the subsidies given by the government on products.
GDP = (GVA) + (Taxes earned by the government) — (Subsidies provided by the government)
In other words, and especially while analysing quarterly growth data, it makes a lot of sense to look at GVA because apart from telling us about the overall health of the economy, it also tells us which sectors are struggling and which are leading the recovery.
Again, absolute data is the better way to assess growth this year. Table 2 provides absolute GVA for various sectors in Q2 going back five years.
While the GVA in all sectors is better than it was in Q2 of last year, four key sectors that play a great part in creating fresh jobs are still below the levels achieved in 2019 or before. These are Mining & Quarrying; Construction and Services such as trade, hotels; and all the financial services. Lower GVA levels would imply lower incomes for those employed in these sectors as well as lower employment opportunities in them.
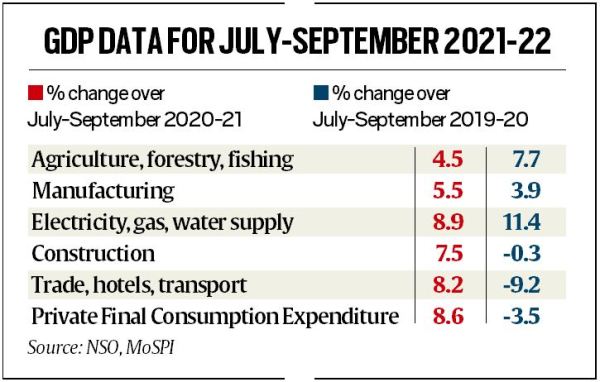 Source: NSO, MoSPI
It is indeed a matter of relief to Indians that the economy is recovering from the recession it went into in Q2 of 2020. However, two data points put the recovery in perspective. One, India’s recovery is still fledgling. A V-shaped recovery would have required the Q2 GDP and GVA to be much higher. It may take another two years to cross those levels.
Two, if we consider the first two quarters (or the first half) of the current financial year, then both GVA and GDP are around 3.5% and 4.5%, respectively, lower than the first half-year of 2019.
The key policy concern from GDP data is the threat to future business investments if private consumption remains weak or constrained. If the latter does not recover fast, the former will likely lose momentum because inventories of unsold goods will build up. Typically, when such a mismatch happens, it is expected for governments to spend aggressively and boost overall demand. That doesn’t seem to be happening at present and this will likely slow down the recovery.
What the GVA data shows is that several contact-intensive services are struggling to recover levels set in the pre-Covid years. With the threat of another variant — Omicron— it is imperative to ensure sustained policy relief to such sectors.
Newsletter | Click to get the day’s best explainers in your inbox
Heatwaves in many parts of India: Why has April beenSubscriber Only
How Indira Gandhi returned to power in 1971 Lok SabhaSubscriber Only

How Sidhu Moosewala's parents are bringing up Baby MoosewalaSubscriber Only

UPSC Key | 30th April, 2024 — International Criminal Court,Subscriber Only

Who wants 370 majority? Not even BJP leadersSubscriber Only
To ensure a hunger-free nation, protect soilSubscriber Only

Is that health drink behind your child being overweight?Subscriber Only