Don’t Split The Streams — Part 7 — Making Sense of Spotify Wrapped for Artists (2021 Edition)
How to make sense of the metrics offered up in the Spotify for Artists’ Wrapped annual stats program
Don’t Split The Streams is an ongoing blog series covering music marketing topics. It specifically focuses on maximizing stream counts and download sales on specific streaming services and retailers such as Spotify, Apple Music, Amazon Music, Beatport, Traxsource etc.
Spotify Data as a Marketing Hook
As I have pointed out several times in the “Don’t Split The Streams” series, many musical artists try and steer their fans and casual listeners of their songs to hear their music on Spotify, in order to maximize their publicly available streaming results. It’s a marketing hook for many artists to be able to say, look “you can see my songs have over 1 million streams”. In part 3 of the series, I looked at a few artists who had over 1 million streams in year and the forces behind their success.
Spotify, YouTube and SoundCloud are the only three music streaming services that publicly display stream counts for individual songs and an artist’s number of followers (YouTube calls them “Subscribers”). Spotify goes further than YouTube and SoundCloud, displaying how many individual users are listening to an artist in a 28 day period (the stat is called “Monthly Listeners”).
Understanding Spotify Wrapped for Artists 2021
Spotify is the only music streaming service that provides an annual review of an artist’s performance on their platform. An artist’s streaming data for the year is packaged nicely as a multi-slide interactive slideshow known as “Spotify Wrapped for Artists” which is released the first week of December each year. You’ll see many artists sharing slides from their own report across social media channels — Facebook and Instagram posts, Twitter, etc.
“Spotify Wrapped for Artists” changes from year to year in terms of what metrics are provided in the package. In 2021, Spotify is providing new data points that have never before been offered, such as number of times a link to a song has been shared, or the number of playlists to which a particular song has been added. The goal of this post is to help artists understand the meaning of specific stats that are being revealed in their 2021 reports. In this post as I do throughout this blog series, I use streaming data from my own music project, FSQ (Funk Style Quality) to help other artists to understand what to examine further in their own set of streaming data. 2021’s analysis is very different than the one I undertook last year.
This certainly is a TDLR post but please keep reading. I will produce a follow up to this post that gives an artist bullet points on the extra steps they should take to enhance their Spotify Wrapped for Artists report, summarizing many of the techniques I cover here for my own analysis with FSQ. Also if you are looking for the full list of stats that the Spotify Wrapped for Artists 2021 report offers, I offer a PDF which lists all the data points in this year’s report.
Before I go through the list of Spotify Wrapped for Artists stats, it’s important to point out that Spotify for whatever reason seems to have hidden an artist’s ability to see these annual stats on their own. Most of the stats on Spotify for Artists do not have a search option for “past 12 months” or for custom date ranges. What this means is it’s difficult to do your own annual review of your data without the help of the “Spotify Wrapped for Artists” report.

Recently Spotify for Artists added new “engagement” metrics that allow artists to dig deeper on how listeners are interacting with specific album, EP and single releases. I noticed the new engagement metrics now offer data views of the “past 12 months” or choose a “custom date range”.

However getting an annual look (12 month period, or other custom time frame) at the overall artist metrics is still not possible on Spotify without the help of the “Wrapped” report. Right now the data view options are : last 24 hours, last 7 days (week), last 28 days (month), since 2015, and all time.

Note that Spotify Wrapped for Artists only is covering from January 1st to October 31st so it’s a 10 month period, not a full year, per their FAQ about the report.
Chartmetric, a paid subscription data service, pulls in data from Spotify and gives artists the flexibility to visualize their data, and look at it in an annual format.

Apple Music for Artists Wrapped
Artists should be taking stock of their annual performance on all streaming services. Apple Music for Artists makes it easy for artists to execute as there are ways to view data by year. With Spotify having 32% of global market music subscriber share, and Apple Music at #2 in terms of market share with 16% according to MiDIA research, it makes sense for artists to focus in on their results on these two streaming services.
For Apple Music, an artist can choose many data views including “year to date” or a specific previous year, for instance, 2019, 2020 or click to current year. The following 2021 data view could be considered FSQ’s “Apple Music for Artists Wrapped”.
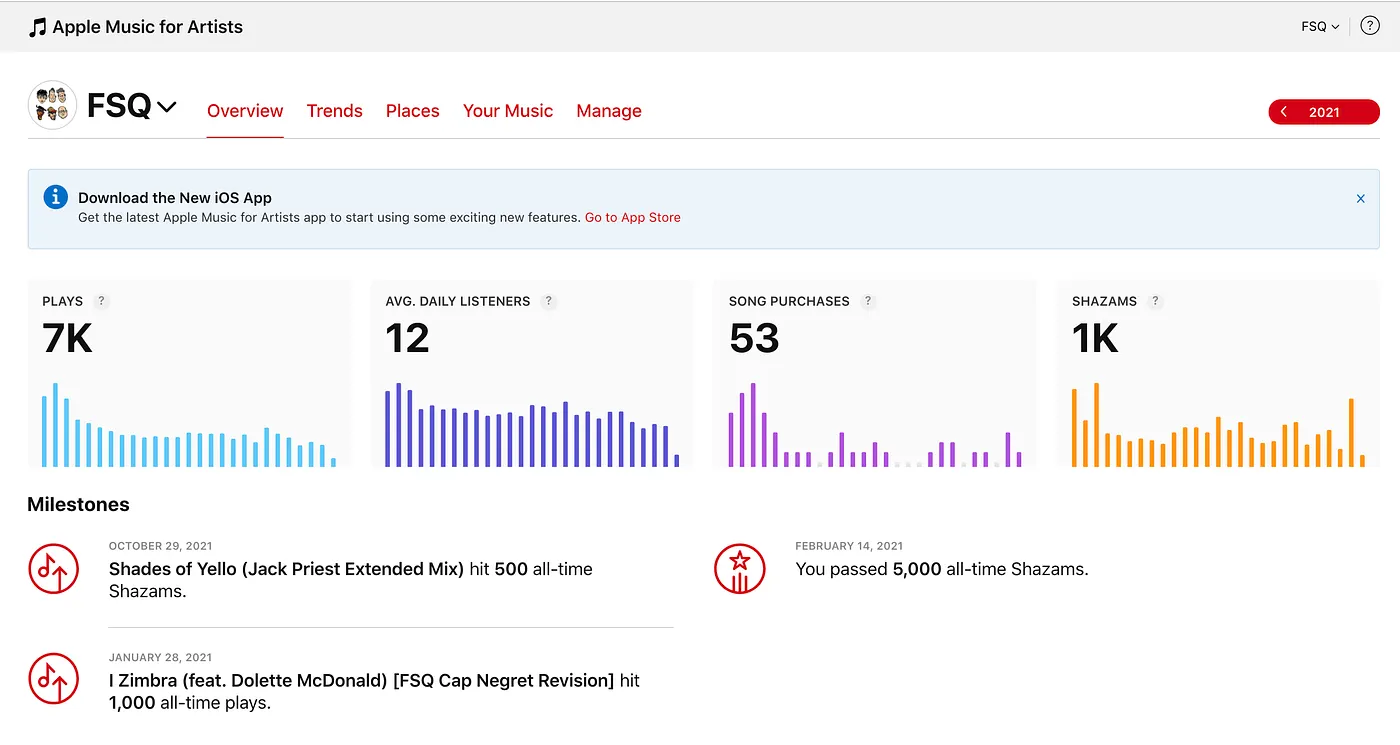
If you’re reading these graphics closely you’ll see that for 2021, FSQ’s stream counts on Spotify are 13X HIGHER than Apple Music (96,000 vs 7,000). Given Spotify’s market share is 2x higher than Apple Music in terms of paid subscribers, it makes sense that an artist’s annual streaming number would be higher on Spotify.
An artist should take their Spotify Wrapped for Artists data and compare it to their streaming stats from Apple Music, YouTube, Amazon Music, SoundCloud over the same annual period
Since a factor of 13x is not anywhere close to 2x, it’s important to understand FSQ’s huge gap in streaming numbers between Spotify and Apple Music. I mentioned this point earlier in the blog series, but it’s worth surfacing it again: Apple Music for Artists only gives artists stream counts when they are listed as “the primary artist”.
Given that a majority of our FSQ productions are remixes for other artists, we are typically listed as a “remix artist”. These terms: “primary artist”, “featured artist”, and “remix artist” are Apple Music metadata fields that describe the roles of music collaborators on a particular song or album. They are also important in terms of how Apple displays an artist’s works to Apple Music subscribers. Most independent artists who are remixing other artists’ songs, will not see their remix work appear on their Apple Music artist profile page. It’s the same thing if an artist is a featured vocalist (or other type of featured collaborator) on a primary artist’s song. These songs will be absent from the collaborator’s artist profile page on Apple Music. Furthermore, artists designated as “featured artists” or “remix artists” will not receive stream counts for their work on other artist’s songs. These metadata tags have two effects on streaming:
- Listeners won’t readily see the full catalog of an artist on Apple Music, leading to fewer streams of the artist’s collaborations and remixes.
- No stream counts for an artist’s remixes or collaborations, unless the artist is listed as a co-primary artist with the main primary artist for the sake of a feature or remix
If there is a major discrepancy between an artist’s streaming volume on Spotify versus Apple Music, likely this metadata field is one of the major causes.
Now there are a bunch more stats on the Apple Music annual stats that an artist should examine, but this post is about Spotify Wrapped for Artists 2021, not Apple Music so I will turn back to that report in just a minute. Regardless …
I’m just making the point that the data sets on multiple streaming services could be wildly different and looking at just Spotify at the end of year, you’ll miss out big annual streaming trends.
For example, on Apple Music, 20% of FSQ’s 2021 streams came from Japan. This is a new trend for us this year.

Why is Japan so big for FSQ on Apple Music in 2021? Our FSQ album “Reprise Tonight” was released late in 2020 as a CD in retailers across Japan, including Tower Records where it was marketed heavily. Likely the marketing push within the Tower stores and on local broadcast radio by the Japanese record label that licensed the release, led to streaming interest in FSQ.
Meanwhile, there is not a single city in Japan in our Spotify for Artists dashboard that ranks as a top streaming city for FSQ and Japan is sitting at #25 in our top countries list on Spotify (over the past 28 day period). Using the third party Chartmetric view of our Spotify data, Japan is not present in any of our top cities or countries for the year 2021.
I couldn’t find any research about the music streaming market in Japan, but I have to assume that Apple Music has a larger market share there than Spotify just based on the fact that FSQ’s top streaming country is Japan, but only on Apple Music. Apple Music launched in 2015 in Japan, while Spotify launched a year later in the country.
FSQ’s top streaming countries for 2021 on Spotify are the USA, followed by the Netherlands, and France. In France we already had audience momentum because in 2019, we had one FSQ song included on a French DJ’s well trafficked playlist. USA makes sense as #1, it’s our home country. In 2021, we remixed a song for the popular Dutch dance music group, Kraak & Smaak, leading to a burst of streaming of FSQ in the Netherlands starting with it’s release in March. The top streaming countries we have deduced from regularly checking in on this top countries chart point within Spotify for Artists dashboard over the year. There’s nothing in Spotify Wrapped for Artists that offers a list of an artist’s top countries for the year.

Making sense of the annual streaming stats can be difficult, but I am at least aware of these underlying events that drove streaming consumption in particular geographies on Spotify.
What’s new in Spotify Wrapped for Artists 2021 and how to make sense of the data points?
Ok let me dig in here. I’ve highlighted in yellow the data points that are new to the Spotify Wrapped for Artists report.
Some data points disappeared from the previous year’s reports. These are:

It would be hard to get at these data points without Spotify revealing them in the Wrapped report.
Spotify does not offer streaming consumption data by hour, only by day, so without the Wrapped reporting there’s no way to figure this one out.
Regarding the country in the world where an artist had the biggest increase in audience size, I do believe FSQ’s biggest audience size increase in 2021 was in the Netherlands in terms of number of listeners. In terms of percentage growth, if Spotify launched in new nations in 2021, then those new nations could be the largest % increases for the artists in terms of listenership because they are starting from zero. The new geography stats added to the 2021 report do focus on countries where Spotify users listened to an artist for the first time, which given that Spotify expanded it’s service to 80 more countries this year, could be any country within that list of 80 countries.

I would tell most artists that this part of the Spotify Wrapped for Artists 2021 report is more of an advertisement of Spotify’s service expansion this year then any kind of meaningful data.

With Nigeria being one of the most populated countries where Spotify launched in 2021, with over 200 million people, artists will likely find that Nigeria is one of the top 5 new countries where people are listening to them the most in 2021.
It would have been nice if Spotify provided the list of the new countries an artist’s music was heard in for the first time in 2021. In our case we got 18 new unnamed countries, which we assume are on this list of Spotify’s new markets. If an artist got 80 new countries on their Spotify Wrapped for Artists 2021, they are truly loved globally. For the sake of FSQ as a case study with this new stat, I deduct that 25% of the Spotify markets that launched in 2021 did listen to FSQ (18 countries out of 80 total new markets launched).

I encourage artists to check their 5 top countries and cities each month on Spotify for Artists as there is no way to see in aggregate what these are for the entire year. An artist can keep track of their top countries and figure out which countries supported them the most.
We recently used Chartmetric to examine the top country data on a rolling basis for the entire year, which tells us that France, followed by The Netherlands, US, Canada and Mexico are our overall top streaming countries in terms of number of listeners for 2021. Canada and Mexico weren’t our guesses for being in the top five. It’s much more meaningful for an artist to know what top 5 countries streamed their music the most, versus them seeing a bunch of countries Spotify added services in.
I also find it strange that I have to pay Chartmetric to view the very data that should appear in Spotify Wrapped for Artists.

Because I monitor Spotify for Artists on a weekly basis, I know that the UK is a top streaming country for FSQ. So I was surprised to see that it was not one of our top 5 countries overall for the year. So I plugged the UK into our Charmetric data view to see that while UK based Spotify subscribers have been listening to FSQ, they didn’t listen as consistently as Canada and Mexico subscribers did throughout the year. UK listeners hit their highest level with 344 listeners on Friday, April 9th, 2021. It’s pretty amazing that you can see this granular day by day breakdown in terms of listenership by country.

Germany is at the time of writing this post in our FSQ top 5 listeners list by country, as viewed within the Spotify for Artists dashboard. But it hasn’t been the whole year.

Germany recently has been trending as one of the top countries for FSQ but Mexico and Canada usually have more FSQ listeners than the country.

FSQ receives a pretty decent amount of radio airplay in France, Germany, Switzerland, the UK and Australia, which we believe helps support streaming consumption of our music in those countries. We use a few radio monitoring solutions including Radio.tools, Soundcharts and Chartmetric to identify what radio stations played what specific FSQ songs at specific times and dates.

I was also curious about how Australia so I plugged it into the Chartmetric dashboard. For December 7th, 2021 it was our 3rd top country with 69 listeners for the day via the Chartmetric daily listener view. While it’s not in the top 5 countries overall for the past 28 day period as tallied by Spotify, if the trend continues Australia will a top 5 country in terms of listenership of FSQ.

Cities where Spotify listeners streamed an artist the most is missing from Spotify Wrapped for Artists 2021 report. I also add that looking at the “Top Cities” by listenership data from within Spotify is not as useful as viewing it from within Chartmetric. Chartmetric will tell an artist what % of their overall listenership is coming from the top cities. This is a great data point if you are trying to figure out if you have any hits local to a particular metro area.
In the most recent 28 day period, I found for FSQ that no single city made up over 3% of our overall listenership.

In December 2021, with no new FSQ releases to drive streaming, our Spotify listenership in cities is not particularly strong. Yet when we looked at this same data in September 2020, over 23% of our listenership was coming from Paris, and over 4% from London. We had an incredible 2019 / 2020 in France due to that French DJ playlist inclusion.

Next year’s Spotify Wrapped for Artists 2022 can do so much more with geographic data, and it should. In the meantime, artists who want to take a deeper dive into the distribution of their audience can leverage Chartmetric.
Spotify Streaming Data and Playlist Additions
Here are the data points in the Spotify Wrapped for Artists 2021 around streaming consumption and playlist additions.

With the Spotify Wrapped for Artists streaming stats, there should be no surprises for an artist if they are paying attention to their data at least monthly from within Spotify for Artists dashboard. Artists should ask themselves what the factors are that led to their top streamed song being the top —one answer — a large amount of playlists adding that particular song. Our top streamed song for 2021, with roughly 43,000 streams at the time the Wrapped for Artists 2021 report was released, was added to 1,700 playlists. But how much of the overall streaming of this top song was actually driven by these 1700 playlists?
Within Spotify for Artists, an artist can click on the individual stats page for any particular song. We did so for our top streamed song, and then sorted the playlists featuring that song, by the number of streams each playlist drove for that song, from highest to lowest.
We counted up the song streams driven by the top 10 playlists where our song was included and found that 23,921 streams or roughly more than half of the streams of our top song this year came from these popular playlists.
Roughly 30% or 14,305 streams of our top song came from individual users’ “Release Radar” playlists. These personalized playlists are updated weekly by Spotify with new songs from artists that the users “follow” on the streaming service. Given we only have 1200+ followers, we can thank Kraak & Smaak, the artist we made a remix for, for this “Release Radar” boost. Again our top song this year was a remix for Kraak & Smaak, who have 81,000 Spotify followers.
I did some further analysis on our top song, the FSQ remix we produced for Kraak & Smaak, including displaying what other playlists drove streams. Spotify only gives us a time range view of “all time” or “last 28 days” so in this case I used “all time” view as it’s a 2021 release, I’m really only looking at the year. Some other takeaways:
- Curators with well listened to playlists are helpful. Listafina’s Nova 2021 playlist was the 2nd biggest playlist driver of streams of the song, at about 1/3 of what “Release Radar” pushed, at 4,318 streams. I know the playlist curator and pitched him directly to include our remix. I did not use any playlisting tools or services to get this addition.
- Collaborations are key for streaming growth. Spotify maintains a “This is Kraak & Smaak” playlist for the artist, where our remix was included, and that drove 1,400 streams. We aren’t sure if that’s algorithmically generated or curated by a human, but today FSQ is no longer on this playlist. Likely it is algorithmically generated, to present Spotify users with a “Best of” artist experience. Kraak & Smaak also curate their own playlist called “Hours” which continues to grow in size year by year ; our remix is still on this playlist and got about 800 streams on it this year. Spotify’s “Release Radar” was primarily pushing the FSQ remix to Kraak & Smaak followers who out number FSQ followers by a factor of 80 to 1.
- Spotify Editorial Playlists remain elusive, and algorithmic playlists help just a tiny bit. We didn’t get any editorial playlist support on our top song. Spotify algorithmic playlists beyond their “Release Radar” only gave us a tiny push. Spotify’s “Discovery Weekly” led to 57 streams of the remix, but that’s not any indication of how many times the song was included on Spotify users’ “Discover Weekly” it is just the amount of users who at least listened to 30 seconds or more of the remix on their personalized “Discover Weekly” playlist. 1000 streams came from Spotify’s “Radio” feature
While Spotify notes that the remix was added to 1,700 playlists in 2021, at the time of writing it only appears on 943 playlists. This means it has a drop off rate of about 55%. That’s not too high, or but not great either — it means that 55% of playlists that added the FSQ remix, eventually deleted the remix from their playlist. Most curated playlists, especially the more popular ones, are continually updated and songs are removed and replaced.

I encourage artists to look at their top song performances for the year, beyond just the top song which Spotify adds to the “Wrapped for Artists” report. Unfortunately, this view does not exist within Spotify for Artists. Instead, artists can view their “top songs of all time.” For FSQ, two 2021 releases, our remixes for other artists, out performed songs that have been our catalog for years (since 2015).

The inclusion of playlist statistics in Spotify Wrapped for Artists is significant and very positive. Previously there was no way to track the number of playlists an artist had been added to on a weekly, monthly or annual basis. With Spotify’s new engagement metrics, following the number of playlist additions is possible.
One calculation an artist can make from the Spotify Wrapped for Artists report is the percentage of playlists that are adding their songs for the first time. In FSQ’s case, 76% of our songs added to playlists in 2021 were playlists adding FSQ songs for the first time ever. I recommend artists make this additional calculation (divide the number of first time playlists by the overall number of playlist additions for the year). The higher the percentage of playlists adding an artists songs for the first time ever means more discovery of the artist is taking place.

Playlist inclusion stats for all songs in an artist’s catalog can be viewed within in Spotify for Artists, for the previous 28 day period. This time frame view is the only available right now as these Spotify engagement stats are new and are still in beta. For individual releases where the artist is the main release artist, more specific time frames can be viewed such as custom, or within the past year.
Unfortunately the playlist inclusion stats can’t be viewed by specific song, so for instance for FSQ’s last 28 days we see that our songs were added to 360 playlists — but no idea on what specific songs were added. Artists should be playing attention to any blips in these stats.
For example, I see that on Thursday December 2nd, FSQ songs were added to 29 playlists, way beyond the running average of about 10–15 playlist additions per day. So I have to think about any event that could have led to the higher interest in adding FSQ to playlists on this day — was it radio airplay? a tweet, a Facebook or Instagram post about FSQ? a major playlist adding FSQ? — something was driving higher than normal interest on this day.

“Saves” is another stat available in these 28 day engagement view — this means anytime a Spotify user clicked “save to library” on any of an artist’s songs, or EP or album releases.

The overall number of “saves” of an artist’s songs is included in the Spotify Wrapped for Artists 2021 report.

FSQ’s number of song saves, 5,728 is very close to the number of FSQ songs added to playlists for the year, at 5,299. Because Spotify users can also “save” playlists, we assume any time a song was added to a playlist it was also saved to a users’ library.
“Saves” and “Shares” data are new metrics in the Spotify Wrapped for Artists 2021 report. While “Saves” appears also in the 28 day rolling Spotify Engagement metrics accessible at any time in the Spotify for Artists’ dashboard, “Shares” data, at the time of writing this post, is only visible in the Wrapped report.

I believe a “share” happens any time a user clicks on specific song, EP or album and then hits the “share” button, which allows a user to copy a link to the song, EP or album release. This action is pictured here:

However, clicking “share” or “copy link” doesn’t necessarily mean the Spotify user followed through and actually posted that link somewhere on the internet. An artist can hope that the user did follow through, and most probably do, but the Spotify tally of “shares” does not actually track the reach of the copied links once they are posted. I could use some more clarification from Spotify on what “Shares” really means, but I believe it only means the number of times Spotify users clicked on a “Share” button somewhere in the artist’s catalog. Also I think users are not really clicking that “Share” button that much — FSQ only tallied 287 Shares for 2021, which would only be 5% of the total amount of playlists our songs were added to in 2021.
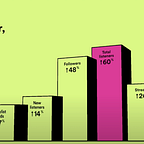
Do not be fooled by the Wrapped stat that says an artist’s shares are up +999% for the year, Spotify never kept track of this stat before 2021 so this will be the default year over year growth for any artist.

Meanwhile the percentage growth increase in terms of followers, listeners and playlists are always a part of the Spotify Wrapped for Artists report.

An artist should have a good sense of what drove any growth for them in the report. Here is my analysis for FSQ in 2021.
198% Growth in Followers —Advertising is a key driver
I wrote in previous “Don’t Split The Streams” posts that Spotify has not done much to encourage their users to click the “follow” button on artist profiles. It’s my belief that Spotify users do not understand that if they click the “follow” button, that Spotify will push an artist’s new releases to them in their personalized “Release Radar” playlist, which is updated every Friday.
For 2021, I felt FSQ needed to grow our followers to extended the reach of our new music releases on the “Release Radar” playlist. Indeed we did grow 198% year over year in terms of followers. How did we do it? We executed a small campaign with the advertising service Rise.la with the goal of converting ad viewers into Spotify followers. We gained about 800 followers during the campaign at a cost of $250, which works out to be $3.20 a follower. The cost of non organic audience acquisition seems rather high and I’m not sure we will do another campaign like this again.

Total Listeners Up 68% — Remixes push growth
Earlier in this post, I displayed the graphic showing the top 5 FSQ songs of all time on Spotify, and two of the top 5, including #2 and #5 were released this year. So there’s not much digging to do here, we had two successes with the two remix works we produced, one for Kraak & Smaak and the other for the Colombian Nu-Disco duo MNKYBSNSS with their guest vocalist Life on Planets.
Each remix release spiked our monthly listeners number, with the FSQ remix for Kraak & Smaak taking us to 16,711 listeners in early April about a month after its release, and the remix for MNKYBSNSS featuring Life on Planets taking us to 7,958 listeners within 20 days of its release.

These two remix releases led to roughly a total 24,000 listeners of FSQ (added up in March and June). Overall we had 41,100 listeners to FSQ over the course of 2021, so more than half of our listenership was due to the release of these two individual remixes. Using Spotify’s new engagement metrics, I was able to also measure the 2021 listenership to all releases where FSQ is the main artist. That total was only 10,623 listeners out of the 41,000. So for the past 12 months, 74.2% of listeners were streaming FSQ remix productions for other artists versus our own original songs.

Check your Spotify Wrapped for Artists “streams to listeners” ratio — it’s not listed in the report but easy to calculate.
For FSQ’s “Reprise Tonight”, our original 2020 album release with 8 total songs, Spotify counts its streams to listeners ratio as 2.714 songs streamed per listener over the past 12 months. As album listening as a habit has declined over the years, I feel good about the fact almost 3 songs were streamed from our album per listener - that’s by any listener that chose to engage with the album. (However, it’s also possible listeners can also just be repeating one song from the album a few times).

It is important for an artist to take stock in their overall “streams to listeners” ratio for the year.
Our FSQ Spotify Wrapped for Artists 2021 report says we have 96,200 streams for the period over 41,000 listeners. That’s a streams to listener ratio of 2.34. In a year where FSQ’s biggest releases were two remixes for two individual artists, I feel good about this ratio being over 2, if anything I would have expected it to be closer to 1 stream per listener, as listeners were likely only engaging with the individual FSQ remixes this year.
If an artist had 5 individual single releases over the year, that artist would hope the ratio would be as close to 5 as possible, or at least near 3, so that they know Spotify listeners are hearing their releases versus just one song being streamed somewhere, on one specific playlist.
If the streams to listener ratio is close to 1, it’s likely the case that an artist had one song that performed very well on a playlist but listeners did not take the extra step to engage with the rest of that artist’s catalog.
Playlists up 59%-one song added to 1700 playlists
Spotify Wrapped for Artists says FSQ’s playlists were up 59%. I am taking this to mean the year over year percentage growth of number of playlists that added FSQ songs, as in previous years Spotify wrote out “Playlist Adds” for this stat. I covered this growth earlier in the post — one FSQ remix for Kraak & Smaak went far and wide, and was added to 1700 playlists, accounting for about 32% of all of FSQ’s playlists additions this year.
What else is in the report?

Again, I have this document that lists all the artist stats offered in the report. A list of an artist’s songwriting collaborators is also in the report, but if an artist has participated in any album or EP compilations, these collaborators may not be collaborators at all, they just happen to be on the same release. These are not song collaborators or “team members” as Spotify puts it. Spotify is offering a list of songwriter names that happen to appear on the same single, EP or album release as the artist. Only one of the below songwriters has FSQ ever collaborated with, that’s David Marston. The rest of the names listed here are songwriters who appeared on other songs where FSQ songs or co-productions were also included in the release. Also these releases where FSQ was listed with other artists are not from 2021, so this slide in the report is celebrating past intersections with other artists, not anything particularly current.

The “Audio Aura” image that Spotify Wrapped for Artists 2021 report generates based on the music of an artist, is completely useless and has nothing to do with an artist’s performance during the year.

Conclusion / Thoughts on Spotify Wrapped for Artists 2021 report
The “2021 Audio Aura” while probably meant to be fun, to me is a reminder that Spotify Wrapped for Artists continues to lag in terms of growing it’s depth each year as an annual report for artist’s performance. Why would they include this meaningless Aura slide in the report when artists can’t even find out what top 5 countries listened to their music in a year? I’m reminded of a tweet from digital marketer Steve Mann (pictured) where he bemoaned the lack of data availability in Spotify for Artists.

My biggest takeaway from this year’s report is that I am paying a service provider (Chartmetric) to be able to view my Spotify data and make sense of it for the year. It’s probably more profitable for Spotify to sell the artists data to Chartmetric and have artists pay for access to it. If that sounds a bit harsh, let me instead review some of the pros and cons of this year’s Spotify Wrapped for Artists 2021 report to conclude this post.
PROS:
- Wrapped for Artists is now counting the number of playlists an artist’s songs were added to in the past year, and the number of playlists that are adding an artist’s songs for the first time ever
- The report is revealing the number times a user clicked “Share” and the number of song or release “Saves” by users
- New Spotify engagement statistics which show the number of playlist adds, and saves of an artist’s music for several time windows including custom dates or over the past 12 months, and also by individual release where the artist is the main artist. (accessible apart from the Wrapped for Artists report).
- Spotify gives stream counts to remix artists (* I believe featured artists as well)
CONS:
- Wrapped report misses annual stats that artists want to know about the most including: top 5 streamed songs, top 5 cities and countries in terms of listenership, and country with the biggest listenership growth
- No ability to look at a time frame period of one year within the Spotify for Artists app for most of the big data points like listeners or streams, which leaves users relying on the “Wrapped” analysis. Right now the widest data views jump from “last 28 days” to “all time” skipping over the ability to look at any specific year or custom time frame.
- Chartmetric offers granular day by day Spotify listener stats — why isn’t this data available within Spotify for Artists?
- Some of the calculations from the Spotify Wrapped for Artists report are left to the artist to make — like the streams to listeners ratio for the year, or percentage of playlists adding an artist’s songs for the first time.