Actively Managed Equity
 Overview: All Strategies
 Investor Resources
 Indexed Equity
 Private Equity
 Digital Assets
 Invest In The Future Today
 Take Advantage Of Market Inefficiencies
 Make The World A Better Place
 Articles
 Podcasts
 White Papers
 Newsletters
 Videos
 Big Ideas 2024
ARK’s Expected Value For Tesla In 2026: $4,600 Per Share


The information presented reflects the views and assumptions of the authors at the time of publication. Please note that this research is at least one year old and the authors’ current views may materially differ from those presented without notice. The results will not be updated as ARK’s internal models change, or any information upon which ARK relies upon changes.
Please note that our Tesla Valuation Model was published on April 14, 2022, before Tesla executed a 3-for-1 stock split after market close on August 24, 2022.
ARK’s updated open-source Tesla model yields an expected value per share of $4,600 in 2026.
The bull and bear cases, tuned to the 75th and 25th percentile Monte Carlo outcomes respectively, are approximately $5,800 and $2,900 per share, as shown below.
We provide this open-source model to the public because we believe doing so strengthens the quality of our research. By sharing our assumptions and modeling methodologies we hope to solicit constructive feedback and criticism. As with open-source software, we believe that open-source research will prove to be more robust and accurate than research conducted non-transparently behind closed doors.[1]
Expected (Base), Bear, and Bull Case Tesla Per Share Price Targets
| ARK’s Simulation Outputs | ARK’s 2026 Price Estimate (Per Share) | Significance |
|---|---|---|
| Expected Value | $4,600 | This projection is our expected value for Tesla’s stock price in 2026, based on our Monte Carlo analysis. |
| Bear | $2,900 | We believe that there is a 25% probability that Tesla could be worth $2,900 per share or less in 2026. |
| Bull | $5,800 | We believe that there is a 25% probability that Tesla could be worth $5,800 per share or more in 2026. |
Source: ARK Investment Management LLC, 2022
Our updated Monte Carlo model moves the prior 2025 target out one year to 2026. For the benefit of readers, this article presents “expected” (or “base”), “bear,” and “bull” cases as a way of contextualizing the meaning of our 2026 share price expectations. Methodologically, we arrive at our base-case share price by averaging one million simulations produced by our Monte Carlo model. Our bear and bull cases are the 25th and 75th percentile values, respectively. Forecasts are inherently limited and cannot be relied upon as a basis for making an investment decision, and are built on our modeling that reflect our biases and long term positive view of the company. Please see additional disclosure below on forecasts and hypothetical performance. For informational purposes only and should not be considered investment advice, or a recommendation to buy, sell or hold any particular security.
This research update is based on ARK’s new open-source Tesla model, which incorporates distributions for 38 independent inputs to simulate a range of potential outcomes for the company.
Tesla’s prospective robotaxi business line is a key driver, contributing 60% of expected value and more than half of expected EBITDA in 2026.[2] Across our simulation set, we expect electric vehicles to constitute 57% of the company’s revenue in 2026, albeit at substantially lower margins than robotaxi revenue. The chart below breaks down attributable revenue, EBITDA, and value by business-line in this model.
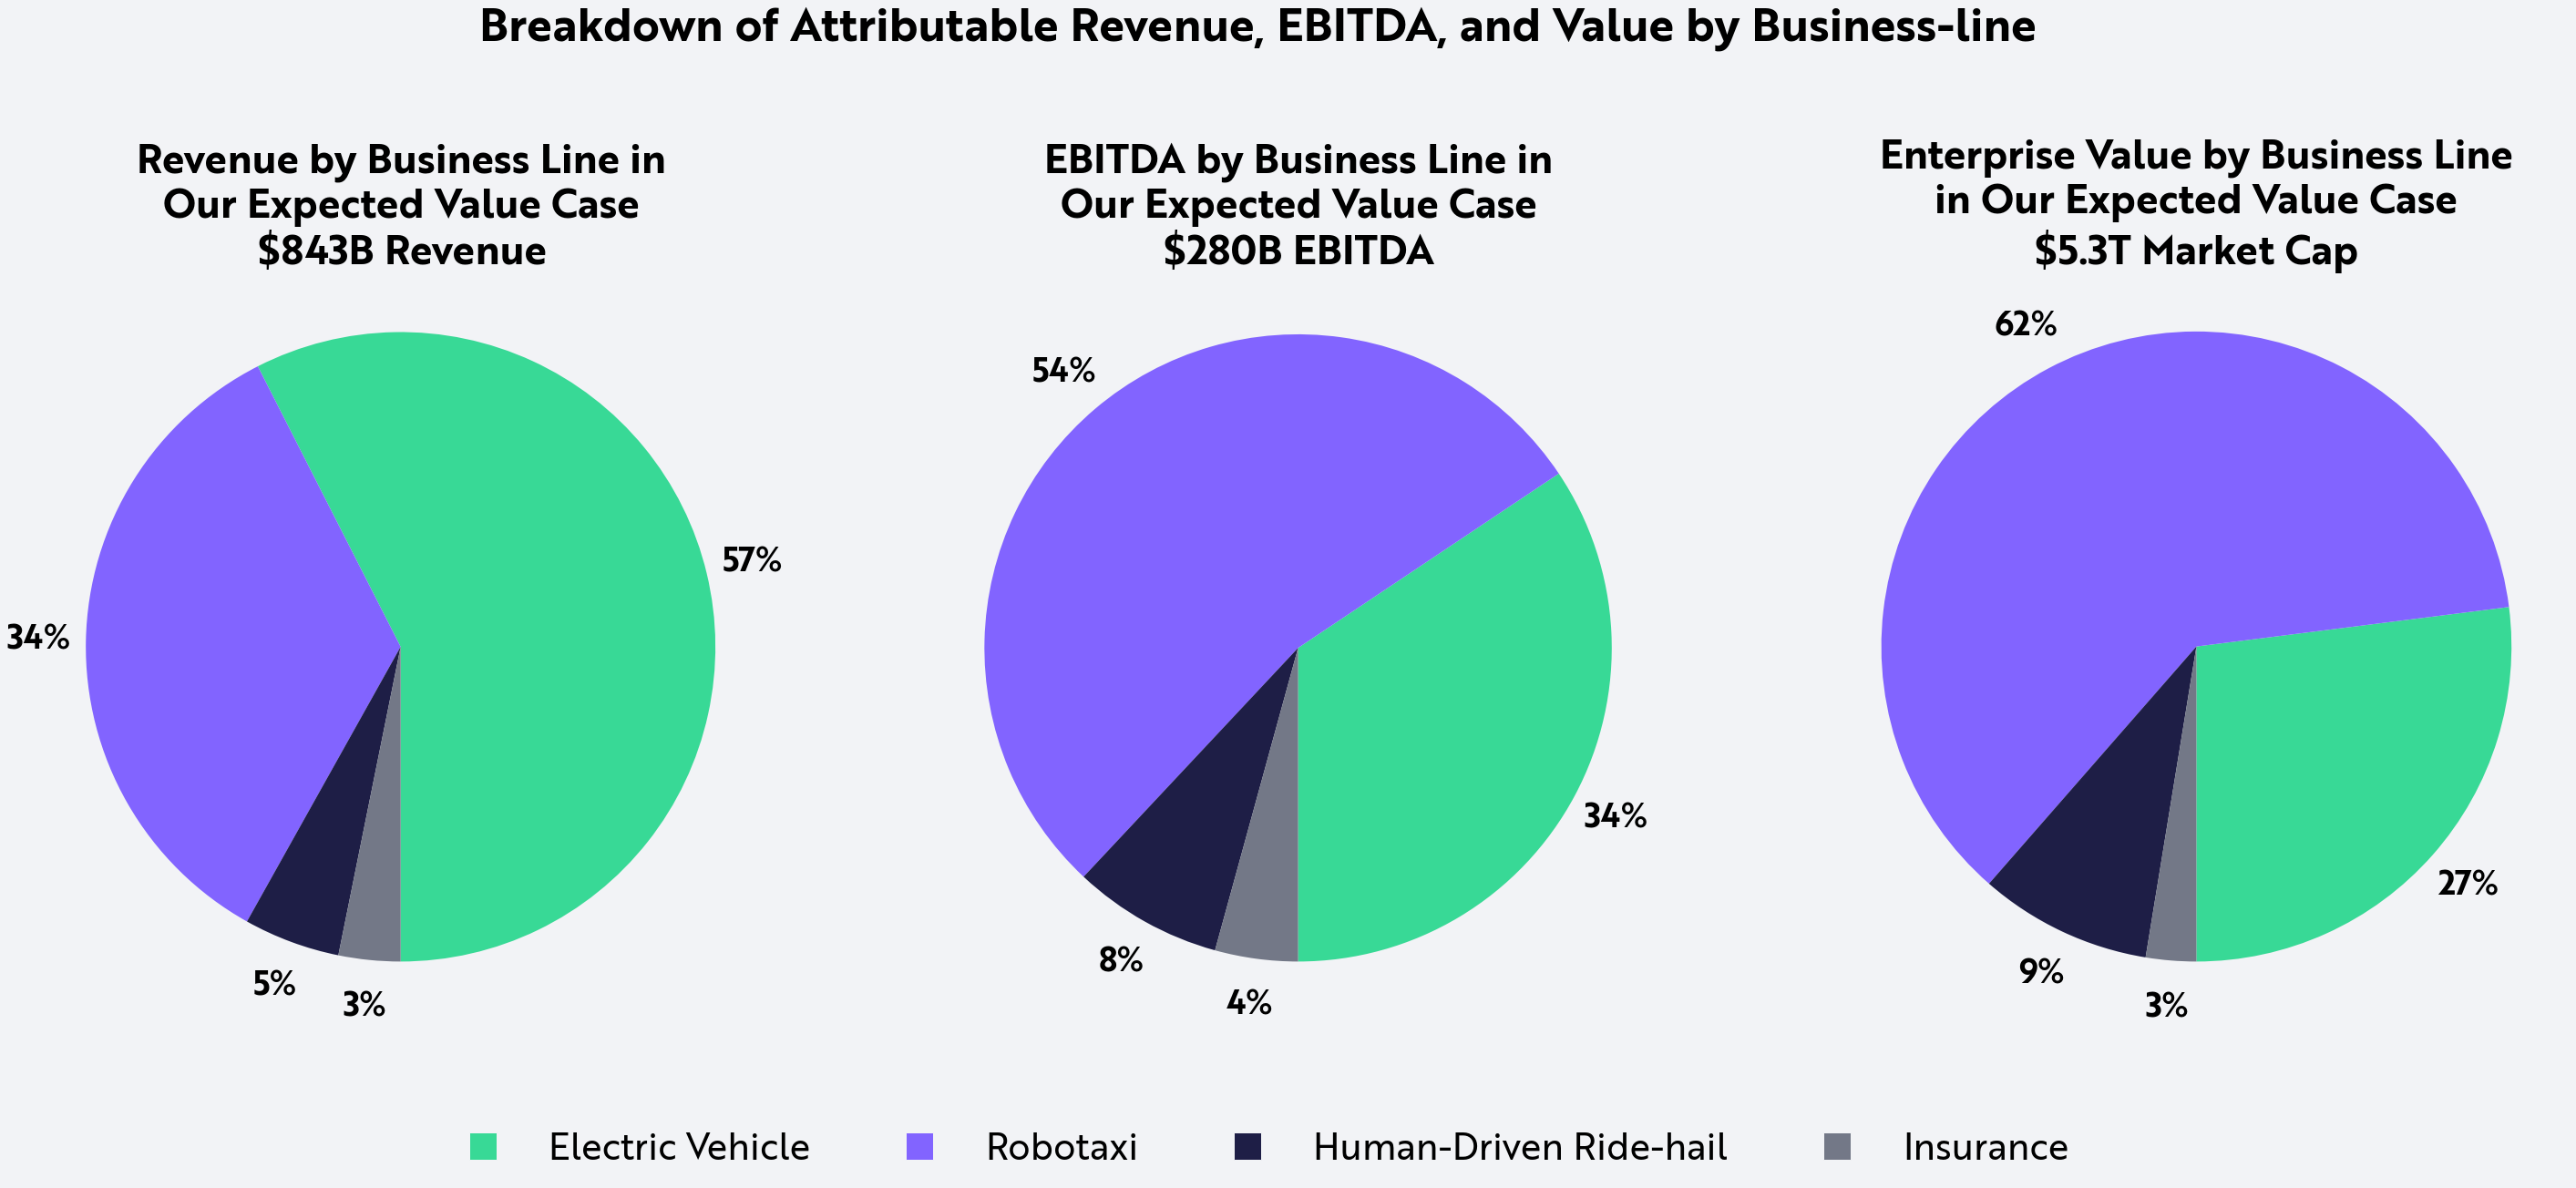
Source: ARK Investment Management LLC, 2022
Forecasts are inherently limited and cannot be relied upon as a basis for making an investment decision, and are built on our modeling that reflect our biases and long term positive view of the company. Please see additional disclosure below on forecasts and hypothetical performance. For informational purposes only and should not be considered investment advice, or a recommendation to buy, sell or hold any particular security.
In this blog, ARK outlines six topics, as well as the risks and limits associated with our assumptions, below:
- Example Bear and Bull Outcomes
- Key Model Assumptions
- Key Updates to ARK’s 2021 Tesla Model
- Model Assumptions That Are Not Key Drivers Of Our Tesla Price Estimates
- Business Opportunities Not Included In The Model
- Tesla 2026 and Beyond
Example Bear and Bull Outcomes
We do not provide a single bull or bear case because we dimension the bull and bear outcomes as the 75th and 25th percentile output from the simulation. Nonetheless, the table below presents what we believe are plausible examples for each.[3]
Example Outputs for Bear and Bull Outcomes
| Example Output* | 2021 Actual | Example Bear Outcome 2026 | Example Bull Outcome 2026 |
|---|---|---|---|
| Cars Sold (Millions) | 0.9 | 10 | 17 |
| Average Selling Price (ASP) | $49,000 | $38,000 | $30,000 |
| Electric Vehicle Revenue (Billions) | $46 | $372 | $513 |
| Human-Driven Ride-hail Revenue (Net, Billions) | $0 | $67 | $0 |
| Autonomous Ride-hail Revenue (Net, Billions) | $0 | $51 | $486 |
| Electric Vehicle Gross Margin (Ex-credits) | 27% | 46% | 34% |
| Total Gross Margin | 25% | 50% | 56% |
| Total EBITDA Margin** | 21.6% | 37% | 35% |
| Enterprise Value/EBITDA | 86 | 14.5 | 17 |
| Market Cap (Billions) | $1,009 | $3,300 | $6,700 |
| Share Price and CAGR*** | $998 | $2,900 (24%) | $5,800 (42%) |
| Free Cash Flow Yield | 0.6% | 4.8% | 4.2% |
Source: ARK Investment Management LLC, 2022
In the table above, we share examplesIn the table above, we share examples of two possible scenarios that correspond with our bear and bull price targets. Please note, however, that there are multiple outcomes within our million simulations that could correspond with the bull and bear price targets. Forecasts are inherently limited and cannot be relied upon as a basis for making an investment decision, and are built on our modeling that reflect our biases and long term positive view of the company. Please see additional disclosure below on forecasts and hypothetical performance. For informational purposes only and should not be considered investment advice, or a recommendation to buy, sell or hold any particular security. *Note: Figures are rounded for simplicity and consistent with reasonable variance in the forecast. 2021 total gross margin includes services, energy storage, and other. **Note: The similarity in bear and bull example EBITDA margins and gross margins reflects our view of the most plausible economics of the two scenarios: Tesla’s human-driven ride-hail and autonomous business lines, which carry higher EBIT margins, make up 30% of EBITDA in the bear case. In the bear case, Tesla doesn’t scale as aggressively and can remain at a higher price point for longer, which benefits its margin structure. In the bull case, the gross margins and EBITDA margins on Tesla’s electric vehicle business decline as it sells into lower priced car segments, offset by the ride-hailing business lines, which make up a larger percentage of profits. ***Note: As of 4/14/22 of two possible scenarios that correspond with our bear and bull price targets. Please note, however, that there are multiple outcomes within our million simulations that could correspond with the bull and bear price targets. Forecasts are inherently limited and cannot be relied upon as a basis for making an investment decision, and are built on our modeling that reflect our biases and long term positive view of the company. Please see additional disclosure below on forecasts and hypothetical performance. For informational purposes only and should not be considered investment advice, or a recommendation to buy, sell or hold any particular security. *Note: Figures are rounded for simplicity and consistent with reasonable variance in the forecast. 2021 total gross margin includes services, energy storage, and other. **Note: The similarity in bear and bull example EBITDA margins and gross margins reflects our view of the most plausible economics of the two scenarios: Tesla’s human-driven ride-hail and autonomous business lines, which carry higher EBIT margins, make up 30% of EBITDA in the bear case. In the bear case, Tesla doesn’t scale as aggressively and can remain at a higher price point for longer, which benefits its margin structure. In the bull case, the gross margins and EBITDA margins on Tesla’s electric vehicle business decline as it sells into lower priced car segments, offset by the ride-hailing business lines, which make up a larger percentage of profits.
Key Model Inputs
The following table presents the ranges for the key inputs to our forecast.
Key Assumptions Underlying the Tesla 2026 Forecast
| Key Model Input Ranges | Worst Case | Downside (-1 Standard Deviation) | Upside (+1 Standard Deviation) | Best Case |
|---|---|---|---|---|
| Using Wright’s Law,* Electric Vehicle Gross Margins Never Exceed | 20% | 40% | 60% | 80% |
| Capital Efficiency (Gross Capex Per Car, USD) | 14,000 | 7,000 | 2,000 | 1,500 |
| Maximum Annual Production Increase** | 20% | 50% | 100% | 200% |
| Max % of 2026 production sold into human driven ride-hail network | 0% | 30% | 60% | 70% |
| Robotaxi Launch Year | 2030 | 2026 | 2023 | 2022 |
Source: ARK Investment Management LLC, 2022
Forecasts are inherently limited and cannot be relied upon as a basis for making an investment decision, and are built on our modeling that reflect our biases and long term positive view of the company. Please see additional disclosure below on forecasts and hypothetical performance. For informational purposes only and should not be considered investment advice, or a recommendation to buy, sell or hold any particular security. *Note: Wright’s Law: https://ark-invest.com/wrights-law/. The simulation drives production as a function of available cashflow for investment in electric vehicle (EV) manufacturing plants but imposes a fixed scaling constraint on Tesla’s ability to grow. Potentially, such constraints could stem from raw material and battery production bottlenecks encountered by the company. **Note: As of March 22, 2022.
Key Updates in 2022:
This post updates ARK’s 2021 open-source Tesla model, which outlined our expected value of $3,000 per share in 2025. Material changes include:
- Autonomous ride-hail assumptions and inputs.
- Capital efficiency estimates.
- Forecast pushed forward by one year to 2026.[4]
Autonomous Driving
Our new model includes updated assumptions for the total market for autonomous ride-hail at each price point, as well as the probability that Tesla will solve for fully autonomous driving. Based on our analysis of consumers’ perceived value of time, we now expect more demand for autonomous ride-hail at higher price points than we had modeled originally. Our research suggests that travelers in western markets place a value on their work-related travel miles close to their hourly wage, and value their non-work-related travel miles at close to half their hourly wage. In low income countries and at $0.50 per mile, we assume another long tail of demand priced similarly to today’s ride-hail options. Taken together, ARK estimates the total addressable market for autonomous ride-hailing at roughly $11-12 trillion, as shown below.
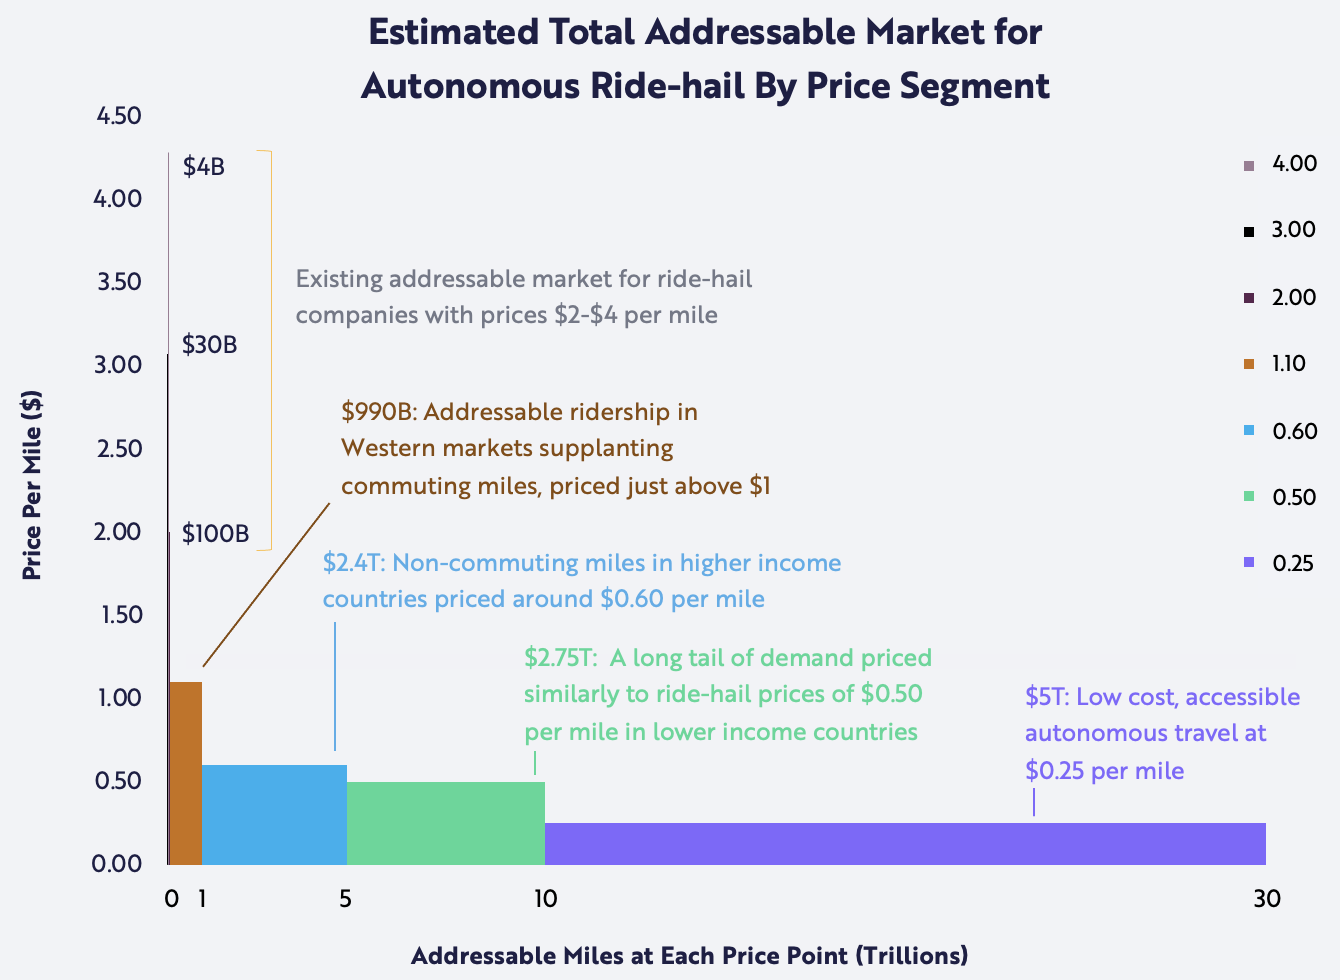
Source: ARK Investment Management LLC, 2022
Forecasts are inherently limited and cannot be relied upon as a basis for making an investment decision, and are built on our modeling that reflect our biases and long term positive view of the company. Please see additional disclosure below on forecasts and hypothetical performance. For informational purposes only and should not be considered investment advice, or a recommendation to buy, sell or hold any particular security.
We also have updated how the robotaxi business feeds into the model, reflecting our increased conviction in Tesla’s ability to achieve full self-driving. The question is when. Whereas our previous downside case assumed that Tesla would never launch autonomous ride-hailing, our updated downside case assumes launch in 2026, four years later than Elon Musk expects. Bolstering our current view are not only the commercial launches of Waymo and Cruise but also fundamental advances in AI.[5] Structurally, the model now allows users to choose both the robotaxi launch year and an adoption rate. The midpoint of our assumptions, as shown in the chart below, suggests that Tesla will commercialize autonomous ride-hail in 2024. In 9% of our model cases, however, Tesla does not commercialize robotaxis within our five-year window. Even in cases where robotaxi does commercialize within the forecast window, our modeled financial results for Tesla are highly sensitive to the year of launch, as described below.
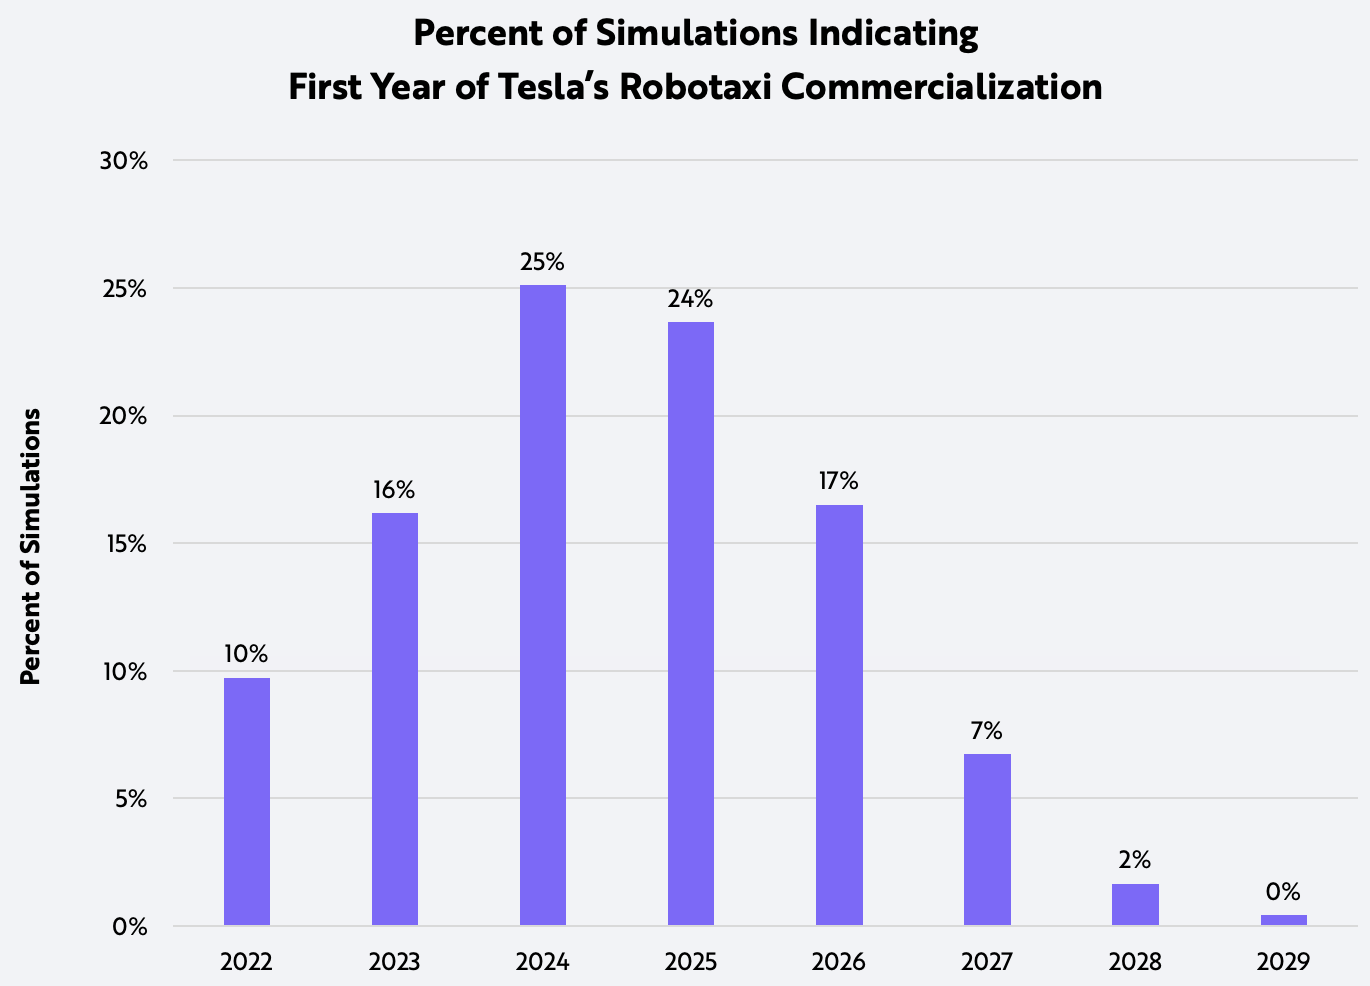
Source: ARK Investment Management LLC, 2022
Forecasts are inherently limited and cannot be relied upon as a basis for making an investment decision, and are built on our modeling that reflect our biases and long term positive view of the company. Please see additional disclosure below on forecasts and hypothetical performance. For informational purposes only and should not be considered investment advice, or a recommendation to buy, sell or hold any particular security.
Capital Efficiency/Maximum Annual Production Increase
Our updated model also increases Tesla’s capital efficiency.[6] Since 2017, Tesla’s capital expenditure per incremental unit of capacity has improved from ~$84,000, when the Model 3 was ramping, to ~$7,700, as shown below. In last year’s model, we estimated that Tesla would spend $6,000-$8,000 per incremental unit of capacity in 2025. Given its much better than expected capital efficiency we now assume that Tesla will spend $2,000- $7,000 per incremental unit of capacity in 2026, as shown below.[7]
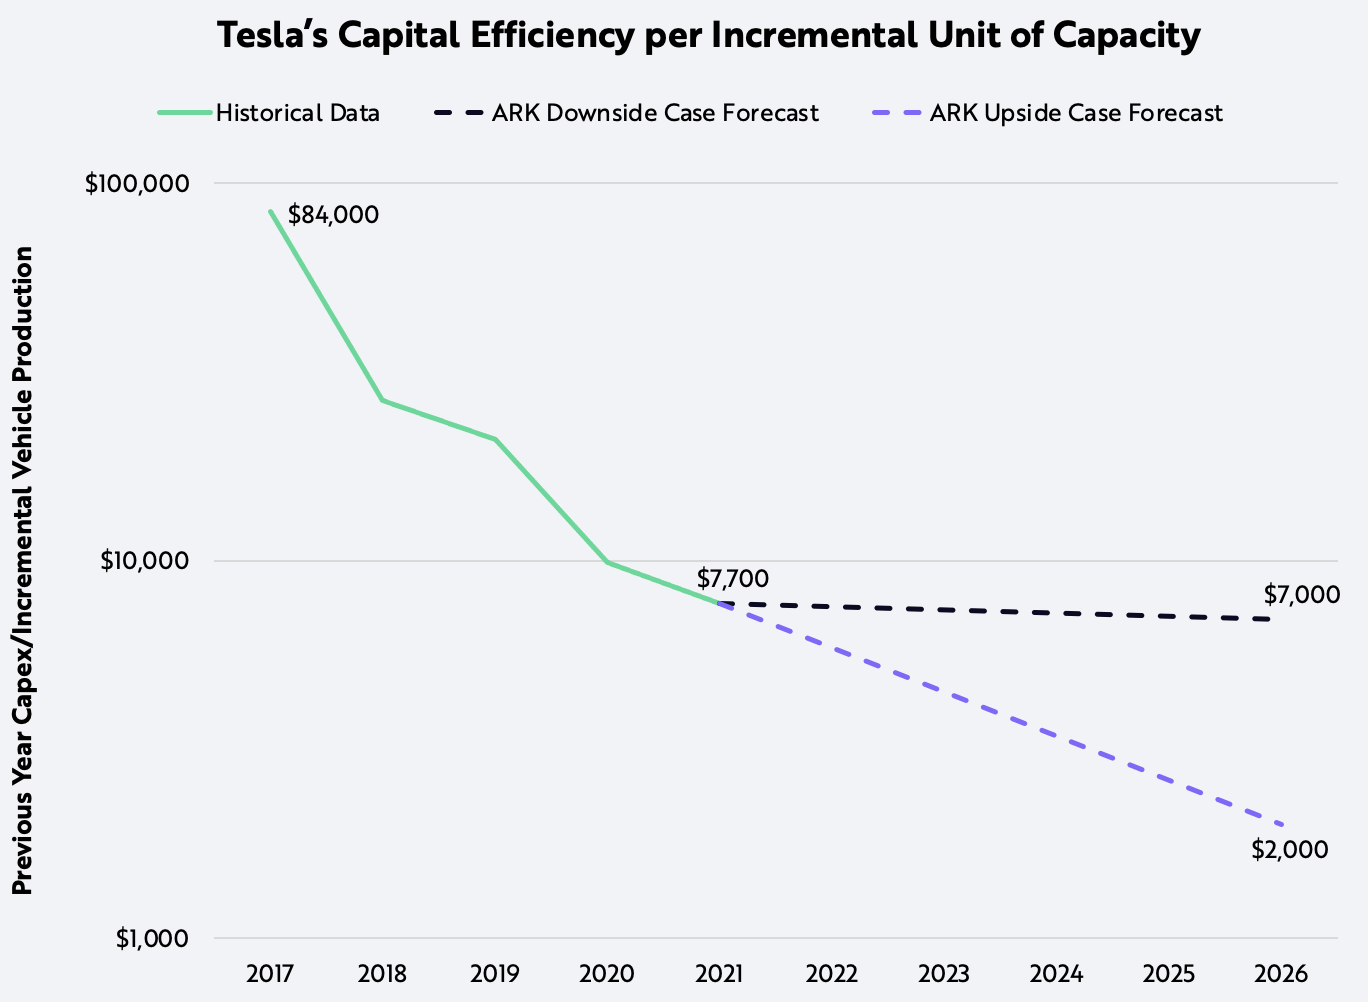
Source: ARK Investment Management LLC, 2022
Forecasts are inherently limited and cannot be relied upon as a basis for making an investment decision, and are built on our modeling that reflect our biases and long term positive view of the company. Please see additional disclosure below on forecasts and hypothetical performance. For informational purposes only and should not be considered investment advice, or a recommendation to buy, sell or hold any particular security.
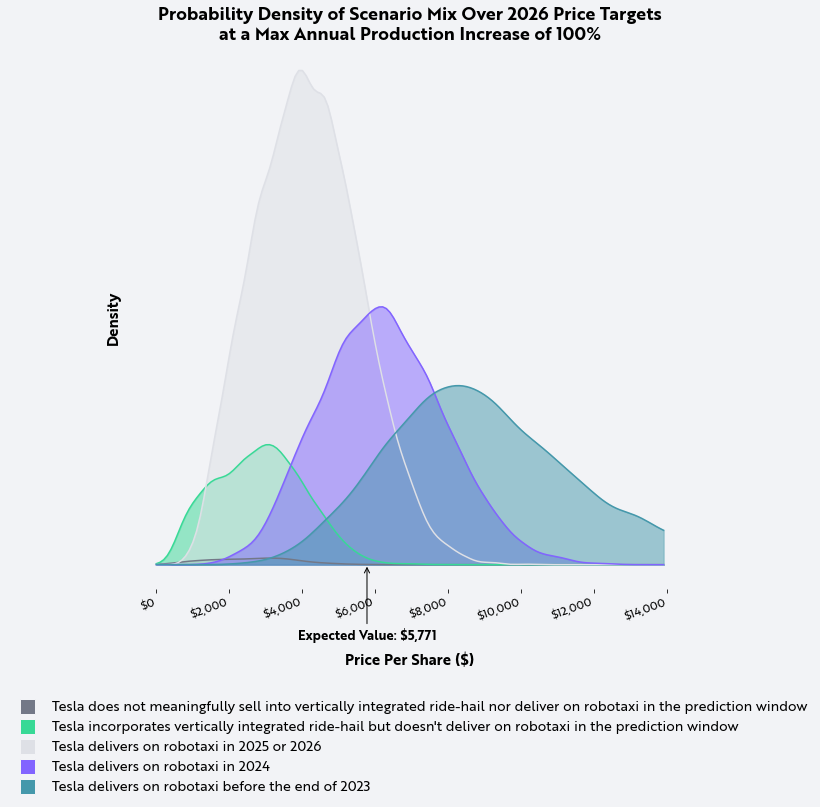
While these improvements indicate that Tesla could continue to increase margins, the more important takeaway is that capital no longer is a bottleneck limiting its growth. Instead, Tesla should be able to grow as quickly as management bandwidth and supply constraints will allow. The model accommodates these constraints by limiting arbitrarily Tesla’s production growth in any given year using the “Max Annual Production Increase” input. Tesla’s ability or inability to scale is a critical driver of its business outcome. The interactive chart below highlights the impact and how changes in maximum possible growth combine with different robotaxi launch years to influence share price estimates in 2026.
Probability Density of Scenario
Source: ARK Investment Management LLC, 2022
Forecasts are inherently limited and cannot be relied upon as a basis for making an investment decision, and are built on our modeling that reflect our biases and long term positive view of the company. Please see additional disclosure below on forecasts and hypothetical performance. For informational purposes only and should not be considered investment advice, or a recommendation to buy, sell or hold any particular security.
Forecast of 2026 Share Price
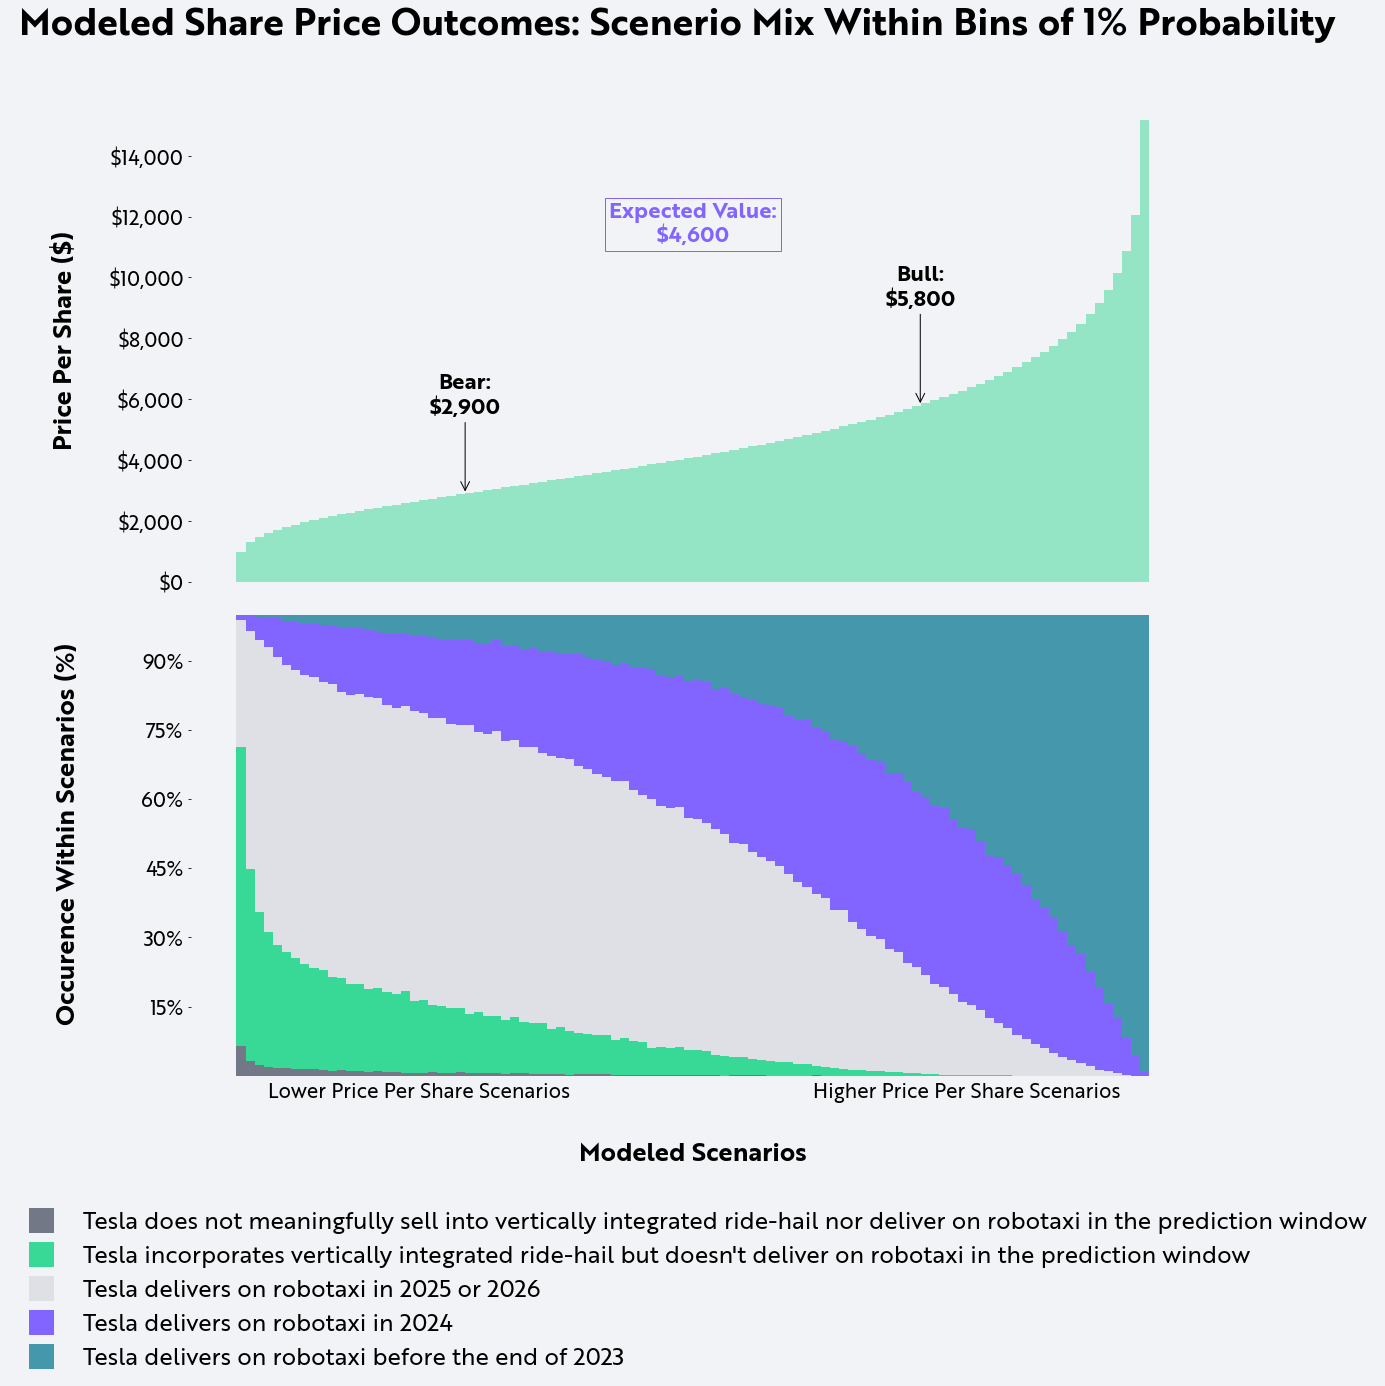
Our simulation is highly sensitive to the year in which Tesla launches robotaxis, as shown in the charts below. The upper chart represents the likely distribution of all possible price targets from our Monte Carlo analysis and identifies the bear and bull cases as the 25th and 75th percentile outcomes, respectively. “Expected value” is the average of all 1 million simulations.
Source: ARK Investment Management LLC, 2022
Forecasts are inherently limited and cannot be relied upon as a basis for making an investment decision, and are built on our modeling that reflect our biases and long term positive view of the company. Please see additional disclosure below on forecasts and hypothetical performance. For informational purposes only and should not be considered investment advice, or a recommendation to buy, sell or hold any particular security.
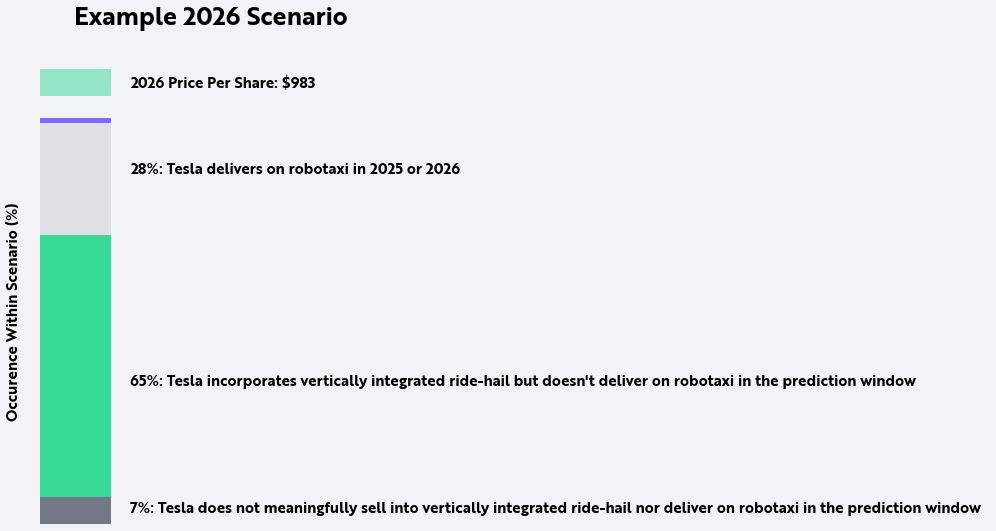
The second chart above illustrates the mix of robotaxi and human ride-hail outcomes that corresponds with each share price expectation represented in the first chart. In many of our lowest price-per-share scenarios, Tesla launches a vertically integrated, human-driven ride-hail service but does not launch a robotaxi network, as shown in light green. In some scenarios, Tesla does not launch either service, as shown in dark gray. While the company has not committed publicly to launching human-driven ride-hail, ARK detailed previously the strategic and tactical advantages of doing so. Importantly, human-driven ride-hail could become a profitable recurring revenue stream before Tesla launches a fully autonomous service. For cases in which Tesla launches a human-driven ride-hail service and solves for fully autonomous driving, we assume that its human-driven ride-hail cars will transition to the autonomous ride-hail network over time. If it is unable to launch a robotaxi service within five years, Tesla still could launch human driven ride-hail while trying to solve for full autonomy. Note that in many of our higher price-per-share scenarios, Tesla launches a robotaxi network in the next two to three years.
The interactive graphic below depicts the modeled mix of human ride-hail and robotaxi more granularly. To test the various scenarios, please use the slider and select a share price outcome.
Tesla 2026 Price Per Share Scenario
Source: ARK Investment Management LLC, 2022
Forecasts are inherently limited and cannot be relied upon as a basis for making an investment decision, and are built on our modeling that reflect our biases and long term positive view of the company. Please see additional disclosure below on forecasts and hypothetical performance. For informational purposes only and should not be considered investment advice, or a recommendation to buy, sell or hold any particular security.
Model Assumptions That Are Not Key Drivers Of Our Tesla Price Estimates
Our updated model includes the following assumptions:
Insurance
- Insurance increases our 2026 market capitalization estimate by roughly 2%.[8]
Bitcoin
- Tesla’s bitcoin holdings are included in the model, along with potential upside or downside swings in price. Though Tesla cannot mark bitcoin up given current accounting standards, we assume that investors will incorporate bitcoin’s impact on enterprise value at its market value in 2026. Bitcoin increases our 2026 expected price per share by less than 5%.
Balance Sheet: We have made conservative assumptions about strategic financial decisions. We do not believe these decisions will be primary drivers of the appreciation in Tesla’s stock price.
- Aside from bitcoin, Tesla keeps cash on its balance sheet and does not invest in any yield-generating assets.
- With more cash than debt, Tesla does not use its cash to pay down debt.
- Tesla will not repurchase shares.
- The interest rate on Tesla’s debt will remain at 4%.
Note: These assumptions could lead to divergences between our forecast of Tesla’s share price and the actual price of Tesla shares. Our modeling cannot include all of the variables that will impact Tesla’s share price and our assumptions could be inaccurate and incomplete. Moreover, our assumptions are subject to change as more information becomes available. Our estimates and forecasts are subject to risks and limitations and should not be relied upon for individual investment decisions.
Business Opportunities Not Included In The Model
Additional business lines and opportunities could be strategically interesting and financially meaningful but are too uncertain at this time. In our view, they are unlikely to be significant drivers of Tesla’s business value over the next five years. For this reason, we have not reflected the following opportunities in our modeling and they do not impact our price estimates:
Tesla’s energy business
- Tesla’s cell constraints are likely to continue over the medium term. Because its most profitable use of cells is likely to be in electric vehicles, we do not expect Tesla’s energy storage business to drive enterprise value meaningfully during the next five years. We have not modeled the option value embedded in Tesla’s ability to turn its battery systems into virtual power plants that allocate dynamically to overtaxed electrical grids. Tesla also could accelerate its energy storage strategy by vertically integrating cryptocurrency mining and home HVAC systems. For now, we place such options beyond the timeframe of this model.
AI-as-a-service
- Tesla has said that it could offer as a service its Dojo supercomputer neural network training. Tesla says that Dojo is on track to do “something useful” this summer, but its meaningful impact probably falls outside of our five year horizon.[9] We forecast that AI-as-a-service companies offering foundation models like Dojo could command up to $20 trillion in enterprise value by 2030, but we incorporate neither that opportunity nor its option-value into Tesla’s 2026 model.[10]
Humanoid robot
- Tesla could bootstrap its learnings from factory automation and autonomous driving, becoming one of the first and few companies to develop foundation models for more generalized AI capabilities and embedding them in Optimus, its humanoid robot.[11] The financial impact of that initiative most likely falls outside our five-year model window.
If any of these opportunities develops more rapidly than expected, they could impact Tesla’s share price positively.
Tesla 2026 and Beyond
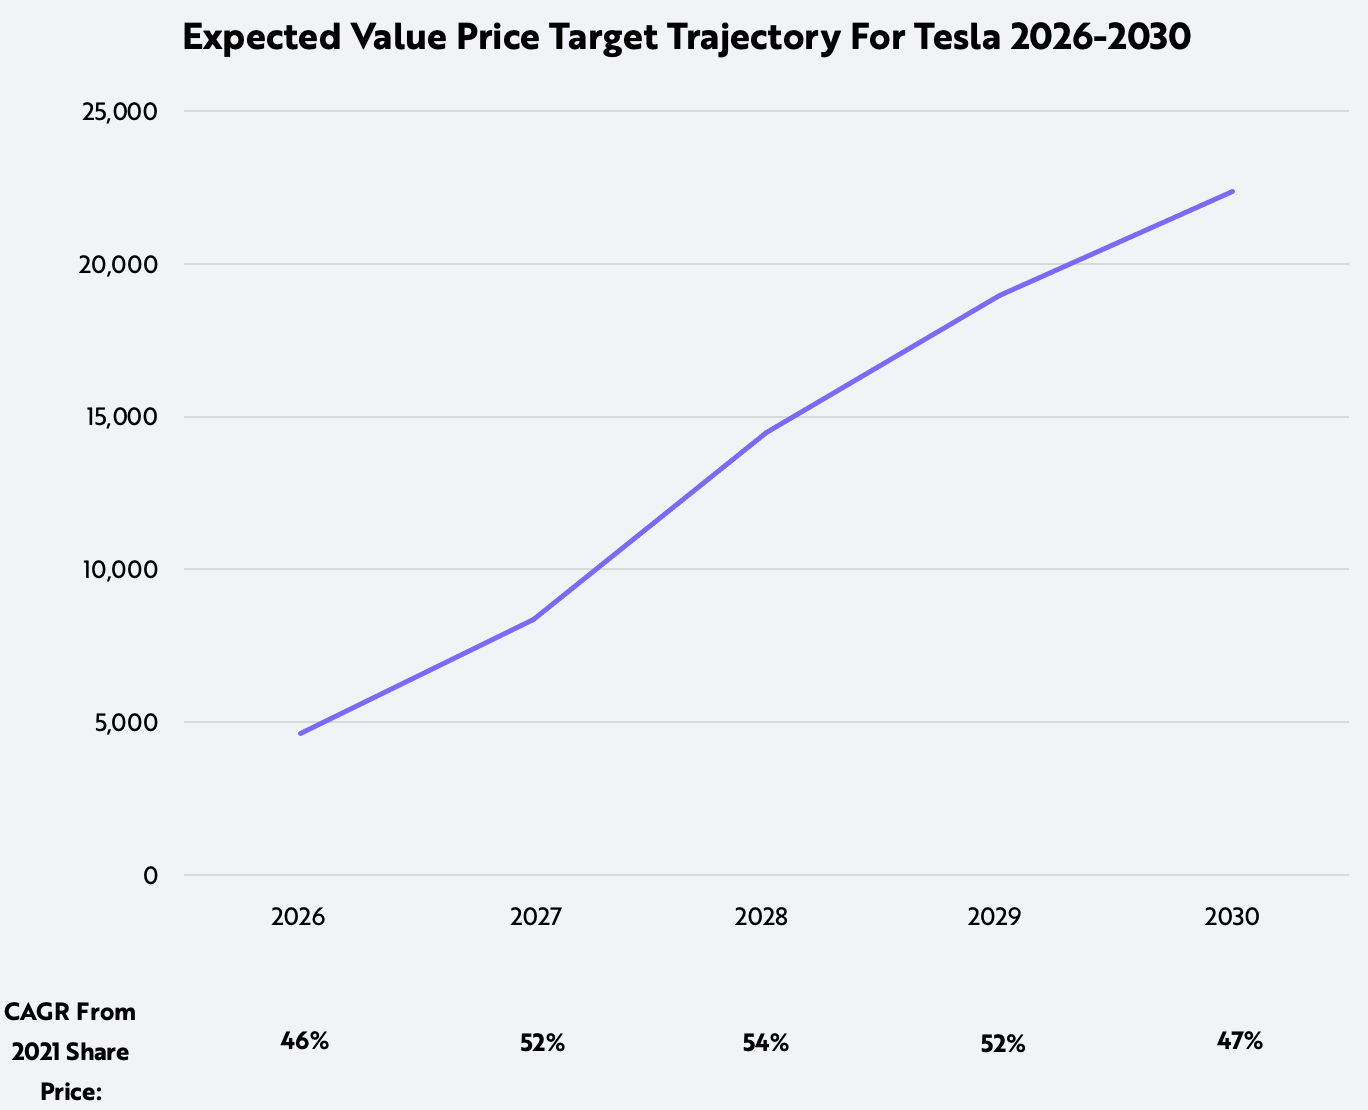
Although tuned to our expectations for 2026, we believe our Tesla model is methodologically conservative: we assume that Tesla’s stock will trade like a mature company rather than a high-growth one in 2026. The terminal multiple used in ARK’s model is probably too low relative to Tesla’s likely growth in 2026, a conservative modeling practice at ARK. As a result, share price expectations are highly sensitive to the year of the price target. Using the existing assumptions in our model and extending them to 2027 results in a materially higher price target and compounded annual rate of return. As shown below, this effect persists if we extend the model to 2030. That said, we have not tuned the model explicitly for that time horizon, raising the risk of potential errors. For example, by 2030, vehicle form factors could change significantly relative to those in our current model, and some of the business opportunities we have not modeled, such as AI-as-a-service, could be more meaningful contributors to Tesla’s financials.
Source: ARK Investment Management LLC, 2022
Forecasts are inherently limited and cannot be relied upon as a basis for making an investment decision, and are built on our modeling that reflect our biases and long term positive view of the company. Please see additional disclosure below on forecasts and hypothetical performance. For informational purposes only and should not be considered investment advice, or a recommendation to buy, sell or hold any particular security.
Conclusion
Given the updates outlined in this article, ARK’s price target for Tesla is $4,600 per share in 2026. Our bear and bull cases suggest that Tesla could be worth roughly $2,900 and $5,800 per share in 2026, respectively. We have published our simulation model on Github and invite readers to explore and test assumptions and/or craft visualizations in the simulations.
DISCLOSURE
The forecasted performance and price estimates herein are subject to revision by ARK and provided solely as a guide to current expectations. There can be no expectation that the specific security will achieve such performance or that there will be a return of capital. Past performance is not indicative of future results.
FORECASTED PERFORMANCE RESULTS ARE HYPOTHETICAL AND HIGHLY SPECULATIVE, AND PRESENT MANY RISKS AND LIMITATIONS. The recipient should not consider these estimated prices alone in making an investment decision. While ARK believes that there is a sound basis for the forecasts presented, no representations are made as to their accuracy, and there can be no assurance that such forecasts or returns will be achieved by the specific security.
The recipient is urged to use extreme caution when considering the forecasted performance, as it is inherently subjective and reflects ARK’s inherent bias toward higher expected returns. Any higher returns should be viewed as a measure of the relative risk of such investments, with higher forecasted performance generally reflecting greater risk. There is no guarantee that any results will align with the forecasted performance, and they might not be predictive. Some or all results may be substantially lower than projected results and, as with any investment, it is possible that you could lose money.
FORECASTED performance results (single security model simulation forecasts) have many inherent limitations. A recipient account might or might not hold this single security, and the account performance will be affected in proportion to its holding size and the amount of price fluctuation over time. No representation is being made that any client account will or is likely to achieve profits or losses tied to a security in the security model forecasts. In fact, there could be significant differences between these forecasted performance results and the actual results realized.
Forecasted performance has not been achieved by the security, and like all modeled, projected or hypothetical performance, it is important to note that there are multiple versions of a model, and ARK has a conflict of interest in that we have an incentive to show you the best performing results. These forecasts rely on models, which calculate hypothetical performance. Several of the limitations of hypothetical performance models include: 1) reliance on a variety of data obtained from sources that are believed to be reliable, but might be incorrect, inaccurate or incomplete and ARK does not guarantee the accuracy or completeness of any information obtained from any third party, 2) potential inclusion of inherent model creation biases, data discrepancies and/or calculation errors that could cause actual results to differ materially from those projected, 3) NO reflection of the impact that material economic and market factors might have had on investment decisions that would have been in actual portfolios being managed at the time and do not involve market risk, and 4) NO guarantee of future investment results. The forecasted results rely on assumptions, forecasts, estimates, modeling, algorithms and other data input by ARK, some of which relies on third-parties, that could be or prove over time to be incorrect, inaccurate or incomplete.
The forecasted returns are based on a variety of criteria and assumptions, which might vary substantially, and involve significant elements of subjective judgment and analysis that reflect our own expectations and biases, which might prove invalid or change without notice. It is possible that other foreseeable events that were not taken into account could occur. The forecasted performance results contained herein represent the application of the simulation models as currently in effect on the date first written above, and there can be no assurance that the models will remain the same in the future or that an application of the current models in the future will produce similar results because the relevant market and economic conditions that prevailed during the performance period will not necessarily occur. The results will not be updated as the models change, or any information upon which they rely changes. There are numerous other factors related to the markets in general or to the public equity security specifically that cannot be fully accounted for in the preparation of forecasted performance results, all of which can adversely affect actual results. For these reasons, forecasted performance results will differ, and could differ significantly from actual results. FORECASTED PERFORMANCE RESULTS ARE SUBJECT TO REVISION AND PRESENTED FOR ILLUSTRATIVE PURPOSES ONLY.
While ARK’s current assessment of the subject company may be positive, please note that it might be necessary for ARK to liquidate or reduce position sizes prior to the company attaining any forecasted valuation pricing due to a variety of conditions including, but not limited to, client specific guidelines, changing market conditions, investor activity, fundamental changes in the company’s business model and competitive landscape, headline risk, and government/regulatory activity. Additionally, ARK does not have investment banking, consulting, or any type of fee-paying relationship with the subject company.
Related Research
