Deutsche Bank has once again produced detailed research, this time on the impact of single game parlays on US online sports betting operators. The team at DB shows how SGPs are altering the interplay between handle, gross gaming revenues and the (higher) hold percentages operators are able to generate thanks to SGPs.
The focus on SGPs is understandable. In a very short space of time they have become a key betting product that attracts the much sought-after recreational punters operators are so keen to recruit. These players hoping for a big win from small stakes also generate far higher hold (margin) percentages for operators through the simple process of SGPs having much shorter odds of being winning bets.
The DB report delves into the impact of SGPs and how they have enabled FanDuel to outperform DraftKings. Indeed, FanDuel is generating higher gross gaming revenues despite recording lower handle than DraftKings and DB attributes this largely to the hold percentage it is able to generate from parlay bets.
The data also looks at whether a sportsbook is focused on ‘sharps’ vs. recreational customers, but with most US brands opting for the latter type of punter, the more relevant question may be how operators can keep losing players returning to bet on SGPs.
How the maths work
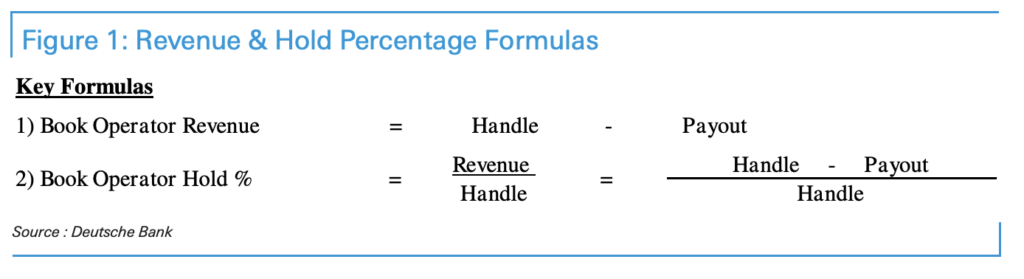
In Figure 1, the hold figure for operators relates to the revenue (handle less repayments to players) as a percentage of the total handle (dollars wagered).
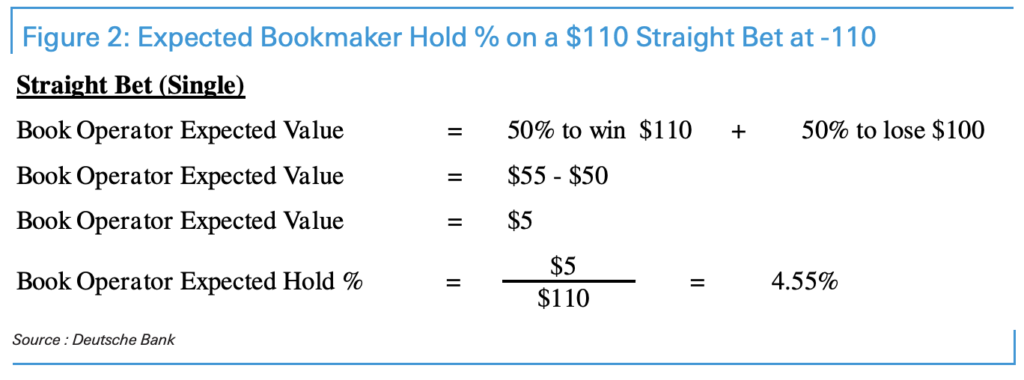
In Figure 2, DB explains how it calculates hold percentage: “In this example, we show a single wager, where a player bets $110 to win $100, a standard -110 offering from the book. As such, the player has a 50% chance of losing $110 and a 50% chance of winning $100. Thus, as one probability weights the two events, they arrive at a $55 (50% * $110) expected loss value and a $50 (50% *$100) expected win value, which implies the book is expected to make $5 on the $110 wager, a 4.55% implied hold.”
SGPs: operator favorites
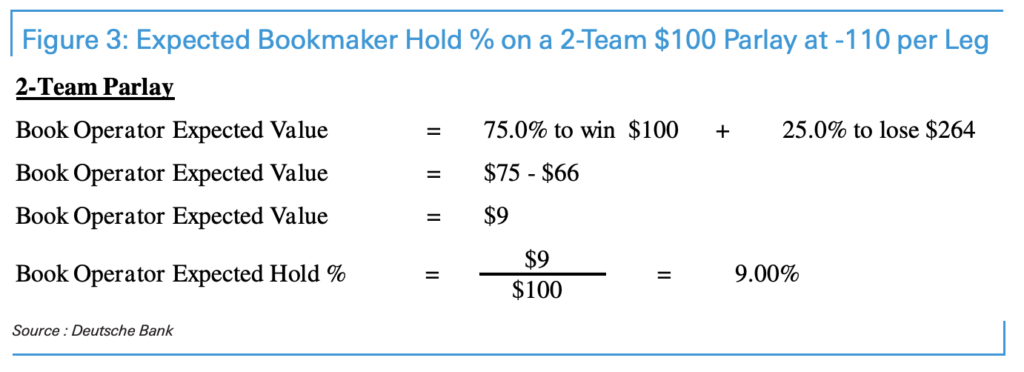
In Figure 3, DB outlines why operators are so keen to get players wagering on parlays. In a two-leg parlay, the likelihood of winning both (independent) legs, is 25%. “Conversely, the probability of losing one, or both, is 75%, meaning you are three times more likely to lose, than win the wager, though you are being paid ~2.6x your wager amount (c$264),” says DB.
To calculate the expected hold percentage for the operator, DB takes “the 75% win probability for the book and multiply it by the (nominal) $100 wager amount, resulting in a payment for the book of $75, should the player lose the wager. We then offset some of this with the 25% chance the player wins $264, which equates to a $66 payout. Thus, the resulting expected hold percentage of 9% stems from the $9 in expected book revenue ($75-$66), divided by the $100 parlay wager.”
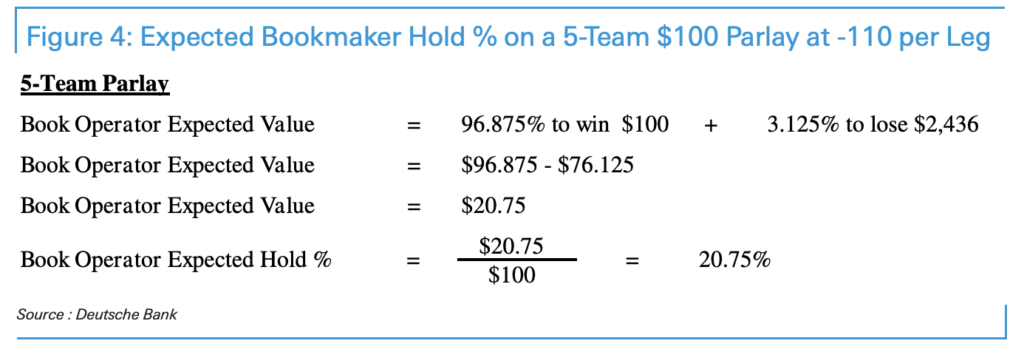
In Figure 4, DB says the case for even larger parlays is also clear. “For the sake of simplicity, the more legs that get added to a parlay, the higher the hold percentage, all things equal,” it says, and with events where pricing is a harder to properly evaluate, such as turnover markets or player-based wagers, holds can climb even higher. Crunching the numbers on a five-wager parlay for $100 and assuming each leg of the parlay is priced at -110, the implied hold would be higher.
Explains DB: “If we assume each leg of the parlay has a 50% chance of winning, the bettor would receive $2,436, at stated payouts, should it win. The bettor will win this wager 3.125% of the time, or 50%^5, which would imply a mathematical payout of $3,200 for a $100 wager. Given the 3.125% chance of the bettor winning the wager, there is a 96.875% chance the bettor loses the wager.
“To calculate the expected hold percentage for the operator, we take the 96.875% win probability for the book and multiply it by the $100 wager amount, resulting in a payment for the book of ~$97, should the player lose the wager. We then offset some of this with the 3.125% chance the player wins the $2,436, which equates to a ~$76 payout. Thus, the resulting expected hold percentage of ~21%% stems from the $21 in expected book revenue ($97-$76), divided by the $100 parlay wager.”
FanDuel vs. DraftKings
DB’s data from New Jersey, Colorado, Mississippi and Illinois shows that over the last 12 months hold levels for parlay wagers vs. non-parlay wagers stood at 17.7% vs. hold of 4.8% on all other wagers.
Looking in more detail at DraftKings’ and FanDuel’s activities in Illinois, the report points out that both operators account for 65-70% of OSB handle in the state and their aggregate share of parlay handle is 80-85%, but FanDuel’s parlay mix as a percentage of its handle is 30.7% in past year vs. 23.1% for DraftKings over the same period, although it has narrowed to 32.1% vs. 28.8% of handle since the start of the NFL season. Illinois is the only state where such granular data is available, but the team at DB says it likely speaks to a broader picture.
What is the overall impact on those companies? FanDuel’s hold rate on parlays is 20.9% vs. 13% for DraftKings, but aggregate hold for FanDuel has been 9.7% vs. 3.9% for DraftKings over the last 12 months, which would point to better trading and risk management from FanDuel.
For DB it could also be the result of first mover advantage for FanDuel’s in-house same game parlay product (launched Dec19), pricing hiccups within DraftKings’ third party parlay product or how promotions and bonusing are used to “skew hold percentages higher when used with greater frequency”.
Related articles: Inflation worries: the impact of promotions on handle and GGR