- India
- International
Need to look at poll data without bias
To understand the changes in Indian electoral politics, many have turned to exit poll and post poll data. But uncritical or biased analysis of survey data can do more harm than good, by producing purported “facts” about caste and communities.
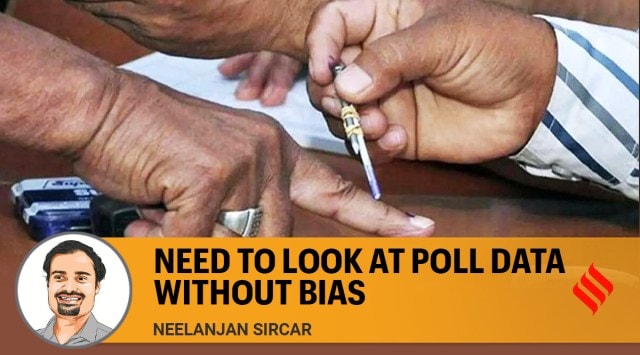 Pollsters have a number of techniques to address these biases, but importantly, most of these methods are applied to the entire sample and cannot be used to correct data from individual caste groups.
To understand the changes in Indian electoral politics, many have turned to exit poll and post poll data. But uncritical or biased analysis of survey data can do more harm than good, by producing purported “facts” about caste and communities.
The science of deducing vote by caste
In a randomly sampled survey, women and lower castes may refuse to respond more often than men and upper castes. And those who choose to answer may display biases (e.g., more likely to report voting for the BJP, than the general population). We also know from research that the identity of the surveyor matters — women may answer differently to male surveyors, lower castes may answer differently to upper caste surveyors and so on. Pollsters have a number of techniques to address these biases, but importantly, most of these methods are applied to the entire sample and cannot be used to correct data from individual caste groups.
In addition to hard-to-correct biases, data on caste groups are necessarily a fraction of the entire sample. The post polls conducted by Axis and Lokniti are among the highest quality surveys, and both nearly predicted the true vote shares of the main parties in UP. Yet, at the level of caste, Lokniti reported that 33% of Jats voted for the SP (54% for the BJP), while Axis reported that 44% of Jats voted for the SP (47% for the BJP).
Some math will help adjudicate here. Lokniti had a sample of approximately 7,000 observations and a margin of error of 3 percentage points. Jats make up approximately 2% of the sample. There simply isn’t enough data to draw clear claims about the Jat community in any survey.
Attribution of intention to outcomes
Across surveys one finds that approximately 80% of Muslims supported the SP. But is this evidence of a community-wide decision? Not necessarily.

Political scientists distinguish between two types of voters, sincere and strategic. A sincere voter will always support her most preferred political party, irrespective of its chances of winning. A strategic voter does not “waste a vote” on an uncompetitive party.
The BSP was perceived to be less competitive, even at the constituency level. Indeed, the BSP’s average constituency-wise vote share dropped to less than 13% — its worst performance since 1991. In our travels, Mayawati’s government was viewed as the most well-functioning across caste and party lines, but votes are not always about governance.
The principle of strategic voting suggests that many Muslims (and those from other communities) may have voted for the SP, even if they preferred the BSP, due to individual strategic incentives and not a community-wide decision. Indeed, as Gilles Verniers has shown, the vast majority of Muslims voted for the SP despite the BSP nominating a higher percentage (16%) of Muslim candidates than the SP (13%).
Did the BSP’s SC vote help the BJP win? Survey data is murky, but election results provide some clues. In 2017, the BSP won 11 of its 19 seats in phases 6 and 7. In 2022, the BSP won its sole seat in phase 6, and the SP alliance improved its strike rate from 13% to 39% over these two phases. Statistical analyses confirm that previous BSP vote share is associated with better SP performance in 2022 — if anything votes transferred from the BSP to the SP.
Consider, for instance, Katehari constituency which the BSP carried with 36% vote share in 2017, besting the BJP (33%) and SP (19%) alliances. This time, the BSP’s vote share was 24% and the SP’s 38% — higher than the BJP alliance which stayed nearly the same (34%). In fact, the SP won all five constituencies in Katehari’s Ambedkar Nagar district (in 2017, the BSP had won two and BJP had won three). Like much of the final 2 phases, the district has a higher than average SC population (25%) and lower than average Muslim population (17%). So the larger SC population does not seem to have helped the BJP.
An uncritical view of quantitative data can lead to specious claims about caste and religious communities. It is incumbent upon us to use it responsibly.
(Neelanjan Sircar is a senior fellow at the Centre for Policy Research. Suraj Yengde, the author of Caste Matters, curates the fortnightly ‘Dalitality’ column)
EXPRESS OPINION
More Explained
May 05: Latest News
- 01
- 02
- 03
- 04
- 05


