Methodology: Zillow Observed Rent Index (ZORI)
The Zillow Observed Rent Index (ZORI) measures changes in asking rents over time, controlling for changes in the quality of the available rental stock.
The Zillow Observed Rent Index (ZORI) measures changes in asking rents over time, controlling for changes in the quality of the available rental stock.
Beginning in May 2020 with publication of April 2020 data, Zillow is releasing a new measure of rental appreciation. The Zillow Observed Rent Index (ZORI) measures changes in asking rents over time, controlling for changes in the quality of the available rental stock in ways that other measures of rental prices cannot.
What’s available to rent at any given time can change rapidly, and measures of median or average prices across time may not reflect actual market-based movements in rent prices, but instead simply reflect the fact that certain unit types are available at different times. ZORI solves this challenge by calculating price differences for the same rental unit over time, then aggregating those differences across all properties repeatedly listed for rent on Zillow.
Underlying the index is Zillow’s industry-leading database of rental properties. To ensure we are capturing the rental market as a whole, and not just those rentals posted to Zillow, we created weights for the index based on the latest data from the U.S. Census Bureau. Units that appear more frequently in the Zillow data hold less weight, and those that appear less frequently are more heavily weighted.
Information on the age of a given rental building and the number of units it contains is obtained from the annual American Community Survey (ACS). Data on age of buildings — the decade the structure was built — goes back to1940; homes built prior to 1940 are grouped together. The number of units in the structure is simplified to three categories: single-unit (detached and attached), 2-4 units and 5+ units.
ZORI is currently calculated at the national, metropolitan, county, city and zip levels for all regions where sufficient data is available.
To better reflect the entire rental market, weights are assigned measuring the prevalence of units being rented that are built in decade d; are of structure type u; and are rented out in year t as reflected by the census and Zillow’s own data. Therefore there are weights for every structure type, decade built, and year rented triple. Let i denote a unique structure type, decade built and year rented triple, then the weight for units of that type is:
![]()
Where Si(c) is the share of census units built in decade d, of structure type u, rented in year t; and Si(z) is the share of Zillow listings in that same rented triple i.
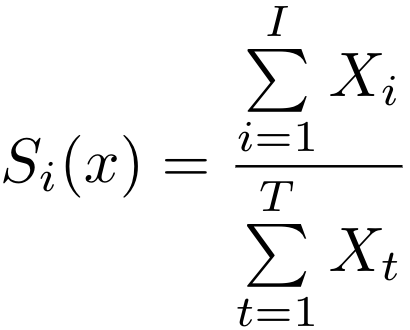
For example, if the Census Bureau indicates that 30% of rented units in a given metro in 2018 were in 2-4 unit buildings built in the 1980s, but only 15% of our repeated rent pairs in that metro match that profile, the weight assigned to those rental pairs would be 2.
The repeated transaction methodology used to calculate the index has a long history beginning in the 1960s. The index is calculated with the price change for all units with more than one recorded sale by regressing changes in rent prices on the change in time between two transactions. The coefficients from this regression form the basis for month-on-month changes reflected in the index values. This strategy was introduced in 1963 by Martin Bailey, Richard Muth, and Hugh Nourse, and further developed by Karl Case and Robert Shiller in the late 1980s. The model is most similar to the approach described by Ambrose, Coulson and Yoshida, 2015, but with one major difference.
In Ambrose et al. the index is calculated using a three-step procedure. In the first step, we regress the log difference in prices for a unit i whose first transaction occurred at time s, and whose second transaction occurred in time t, on a matrix Xit .Those matrix values are −1 if the first sale in the pair took place at time period t, 1 if the second sale in the pair took place at time period t, and 0 otherwise. That is:
![]()
Since we are using log prices, ![]() represents percentage differences in prices from the base year. If we stop here and create the index using this
represents percentage differences in prices from the base year. If we stop here and create the index using this ![]() we are essentially recreating the index from Bailey and coauthors. However, in Ambrose et al. the authors perform a second and third stage where they regress the squared residuals from the first step on (t-s), collect the fitted values from that regression, and use the inverse of the square residuals as the weights in a weighted least squares regression that mirrors the OLS regression from the first stage. This procedure down weights transaction pairs that are very far apart, and puts more weight on transactions that occur more closely together.
we are essentially recreating the index from Bailey and coauthors. However, in Ambrose et al. the authors perform a second and third stage where they regress the squared residuals from the first step on (t-s), collect the fitted values from that regression, and use the inverse of the square residuals as the weights in a weighted least squares regression that mirrors the OLS regression from the first stage. This procedure down weights transaction pairs that are very far apart, and puts more weight on transactions that occur more closely together.
While the inverse time weighting is an important theoretical contribution, we found that in practice it had little-to-no effect on the behavior of the series. Instead, we chose to put more weight on observations that are underrepresented in the Zillow sample, and less weight on those that are overrepresented. Therefore we adjust our second-stage regression to regress the squared residuals from (1) on the weights described in the previous section. The predicted values from this second stage are then used in a weighted least squares regression version of (1). The index values are created from the coefficients from the third and final stage of the procedure.
Once the index is computed, it is smoothed using a three-month simple moving average. A seasonally adjusted series is available and calculated using a proprietary algorithm that is more robust to outlier events such as the 2020 pandemic. Prior to publication, both the raw and smoothed indices are checked against a set of heuristics based on statistics of the time series to flag potential data quality issues so they can be investigated and fixed, or a determination can be made not to publish the series.
To make the index more interpretable, we attach a dollar value to the latest data point in the series and use the index’s month-to-month changes to chain the dollar value back in time. The dollar amount is calculated by taking the mean of the middle 30% (the 35-to-65 percentile) of the asking rent for observations from the most recent month. Using the mean of the middle quintile instead of a straight median better captures small changes in the market, while also reducing noise. To correct for bias in list rents, we use the same weights described above to make the dollar-denominated amount representative of the market of available homes.
