


 Bitcoin sits at a critical support level; here’s the bearish and bullish case
 🚨 This article is 4 years old...
Bitcoin sits at a critical support level; here’s the bearish and bullish case
5 min read
Updated: Feb. 28, 2020 at 11:21 pm UTC

Cover art/illustration via CryptoSlate. Image includes combined content which may include AI-generated content.
More than $56 billion have been wiped off the cryptocurrency market cap in the last week. The massive sell-off took Bitcoin below $7,000 signaling a further decline. Despite the recent downturn, several technical indicators are now warning that BTC could bounce off current levels. The following technical analysis evaluates whether Bitcoin is bound for a continuation of the bearish trend or a bullish impulse.
Bitcoin technical analysis
Since Nov. 18, Bitcoin plummeted nearly 23 percent. It went from trading at a high of $8,540 to a low of $6,620 today.
The sudden nosedive brought out with it a lot of pessimism. Mark Dow, a former US Treasury and International Monetary Fund economist, stated that BTC was “dying.” Meanwhile, Nouriel Roubini, professor at New York University’s Stern School of Business, called it the most “useless and over-hyped technology ever.”
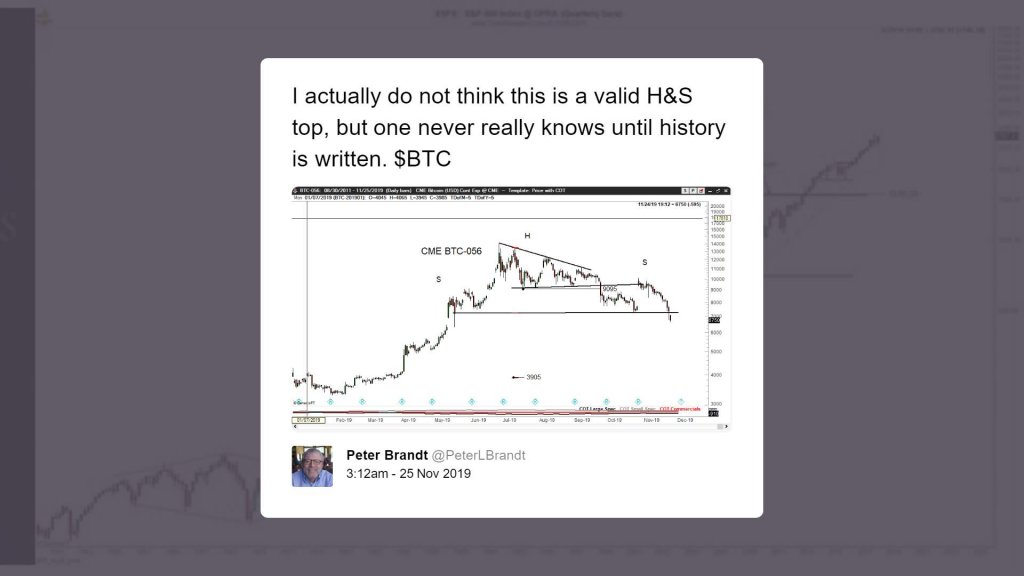
Even the 40-years trading veteran Peter Brandt flirted with the idea that a head-and-shoulders pattern was forming on BTC’s 1-day chart. Although Brandt does not necessarily believe that this bearish formation is valid, he sees it as a probability that could take Bitcoin down to $3,905.
Bearish scenario
A further correction seems feasible based on several technical indexes. The TD sequential indicator on the 1-week chart, for instance, presented a sell signal the moment the current red two candlestick began trading below the preceding red one candlestick. This bearish signal estimates that the next support level sits around the setup trendline, at $4,900.

This is also where the 200-week moving average is hovering around. Therefore, a move below the 150-week moving average could signal a drop down to the setup trendline or the 200-week moving average.
Based on the Fibonacci retracement indicator, the 9 percent Fibonacci retracement level served as strong support in late December 2018. And, as strong resistance during the first four months of this year. Thus, if Bitcoin closes below the 23.6 percent Fibonacci retracement level with enough volume, it could try to test the 9 percent Fib for support. This Fibonacci level is sitting around $4,200, which coincides with Brandt’s bearish outlook.
Bullish scenario
Nevertheless, there is a chance for bitcoin to bounce off current levels. The downturn in the market took BTC to the bottom of a descending parallel channel that is developing on its 1-week chart since the week of June 24. Since then, every time the pioneer cryptocurrency reaches the bottom of the channel, it bounces off to the middle or the top. But, when it reaches the top, it falls back to the middle or the bottom.
Bitcoin is currently trading around the bottom of the channel. If the buying pressure behind BTC increases, it could rebound and hit the middle or the top of the channel, like it has done it in the last five months. Such a bullish impulse could take this crypto to $7,400 or $8,500.
This is also where the chief technical officer at IntoTheBlock, Jesus Rodriguez, sees a significant amount of resistance based on the “In/Out Money” model. This metric takes into consideration the distribution of Bitcoin throughout individual wallets based on the current price. At the moment, there is strong resistance between $8,000 and $8,800, with 3.25 million addresses containing 1.94 million BTC.

Additionally, the Short Positions on Bitfinex appear to have been rejected by the 100 and 150-day moving average. This could imply two different situations. First, the number of investors anticipating that the value of Bitcoin will decline in the short term is decreasing. Second, those investors who were betting to the downside are currently getting out of their positions or getting liquidated as BTC starts to rebound. If this is the case, BTC could be going through a short-squeeze, which usually anticipates a spike in the prices of the underlying asset.

Meanwhile, the Long Positions seems to be breaking out to an ascending triangle. This technical pattern developed on the 1-day chart since April as a direct result of Bitcoin’s price action. A horizontal line formed along with the swing highs and a rising trendline along with the swing lows.
By measuring the height of the triangle, at its thickest point, this pattern presents a 33 percent target to the upside. If validated, the number of long positions behind Bitcoin could rise to hit the 37,000 orders resistance level. The last time long positions went this high was in mid-February in anticipation of the rally that took BTC to nearly 14,000 by late June.
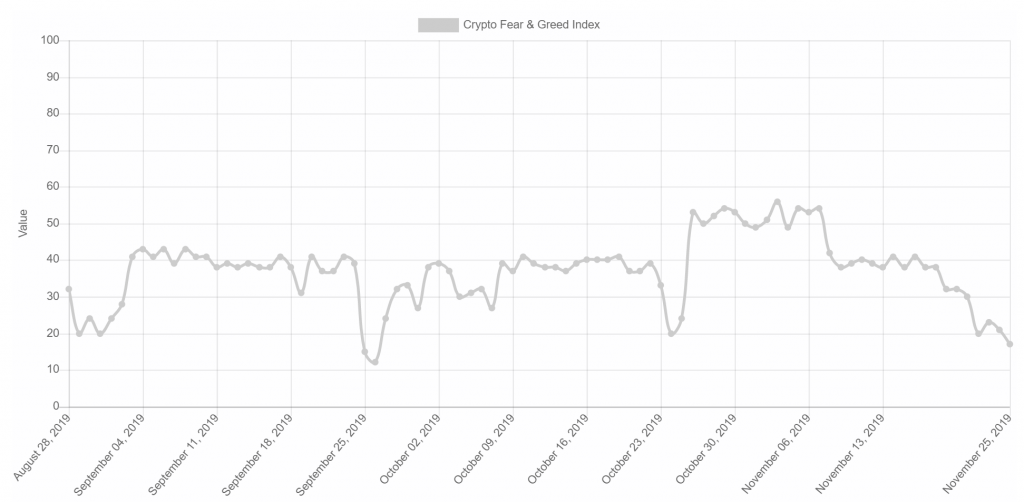
Finally, the recent downturn brought the overall market sentiment into “extreme fear,” according to the Crypto Fear and Greed Index (CFGI). Based on historical data, every time the CFGI goes into “extreme fear,” a buying opportunity is presented.
Back on Oc. 24, the CFGI went into “extreme fear,” but the next day BTC surged over 40 percent. A similar scenario happened on Aug. 31, which was succeeded by a 13 percent upswing.
If the CFGI is indeed signaling a buying opportunity this time, Bitcoin could be bound for a bullish impulse. This could take it to hit the middle or the top of the descending parallel channel previously explained.
Moving forward
The recent price action that Bitcoin went through has taken many investors out of their positions. Meanwhile, some of the longtime crypto critics, such as Peter Schiff, are feeding the public with fear uncertainty and doubt (FUD) suggesting that BTC is going down to $1,000. This is the overall sentiment of the market. In fact, the Crypto Fear and Greed Index is currently perceiving “extreme” levels of “fear” among investors.
Despite the current conditions, it seems like Bitcoin is now preparing to shake out those who are pessimistic about its future. Several technical indicators are pointing out that this cryptocurrency could be preparing for an upswing. If validated, BTC could rise to $7,400 or even $8,500.
Mentioned in this article


Latest Bitcoin Stories


You might also enjoy...

Latest Press Releases


In this article
Bitcoin, a decentralized currency that defies the sway of central banks or administrators, transacts electronically, circumventing intermediaries via a peer-to-peer network.
Bitfinex
Bitfinex is a digital asset trading platform offering state-of-the-art services for digital currency traders and global liquidity providers.
IntoTheBlock
IntoTheBlock is a data science company applying cutting-edge research in AI to deliver actionable intelligence for the crypto market.
Peter Brandt entered the commodity trading business in 1976 with ContiCommodity Services, a division of Continental Grain Company.

Nouriel Roubini serves as the CEO of Roubini Macro Associates, LLC, bringing comprehensive macroeconomic consultancy to the forefront of global finance from New York City.

Jesus Rodriguez is a technology expert, executive investor, startup advisor, and CEO-CTO of IntoTheBlock.
